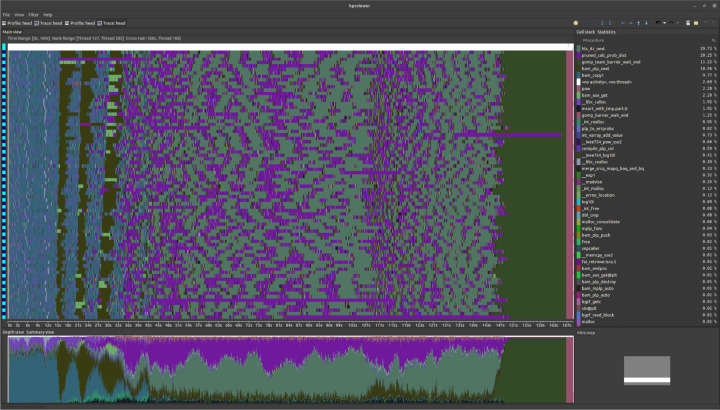
Fig. 2: HPC-toolkit trace results.
X-axis is execution timeline and the Y-axis corresponds to the threads. The window at the bottom is the distribution of work across tasks. Pink is probability computation, teal is BAM file iteration, light blue at left is file decompression, dark green at right is the thread barrier. The image shows one thread causing a load imbalance due to a high-cost column.

