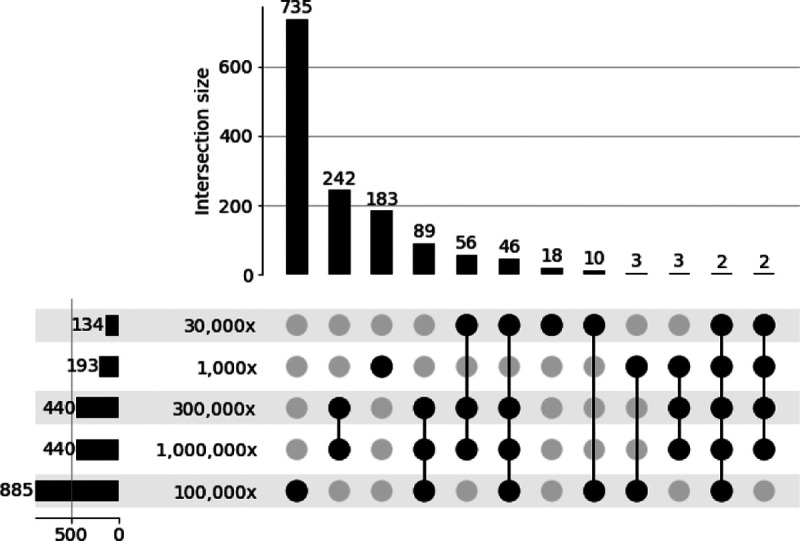
Fig. 3: Upset plot [16] highlighting the shared low frequency variants across all five datasets.

Rows of upset plot indicate the depth-of-coverage per dataset, the columns indicate the intersection of shared single nucleotide variants across datasets. The bar plots located at the bottom left side represent the total number of SNVs identified per dataset.
