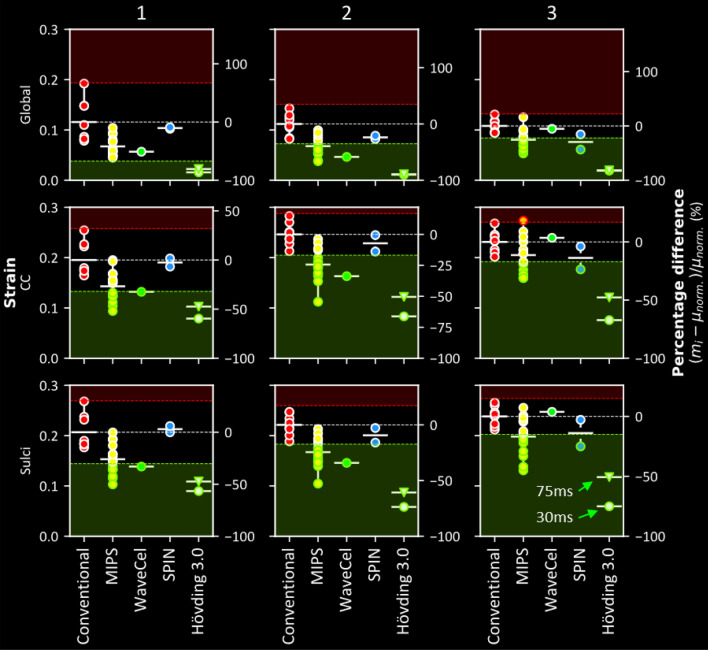
Figure 6.
The performance of all the helmets in impact condition 1 (left), 2 (middle) and 3 (right) grouped by technology (marker fill colour) with respect to the Green-Lagrange strain across the entire brain (global) as well as in brain regions-of-interest (corpus callosum and sulci). For the global and corpus callosum, the 90th percentile strain value was used. For the sulci, the mean strain value was used. Solid white horizontal lines represent the mean metric value of each technology. The dotted white horizontal lines represent the mean for conventional helmets (red). The red and green margins represent regions where the performance would be significantly worse or better than conventional helmets for that metric (p > 0.05). The right-hand side axis of each plot represents the percentage difference of the metric value of each helmet with respect to the mean of the conventional helmets. The results show that, in most cases, helmets perform either significantly better than (green marker edge) or insignificantly different to conventional helmets, with rare occasions where helmets perform significantly worse (red marker edge).

