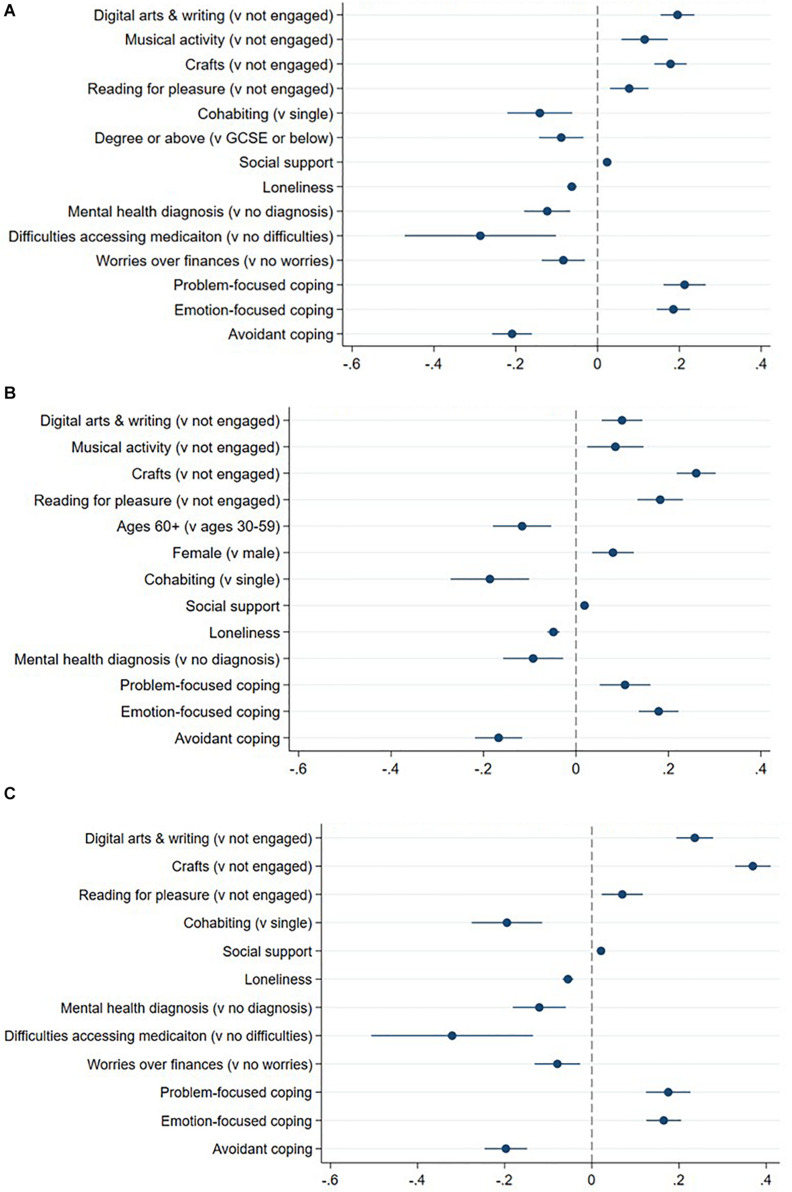
FIGURE 3.
(A) Approach strategy through arts activities. Panel (A) shows coefficients and 95% CIs from OLS regression; the model was adjusted for all covariates. Only results with p < 0.01 are shown. (B) Avoidance strategy through arts activities. Panel (B) shows coefficients and 95% CIs from OLS regression; the model was adjusted for all covariates. Only results with p < 0.01 are shown. (C) Self-development strategy through arts activities. Panel (C) shows coefficients and 95% CIs from OLS regression; the model was adjusted for all covariates. Only results with p < 0.01 are shown.

