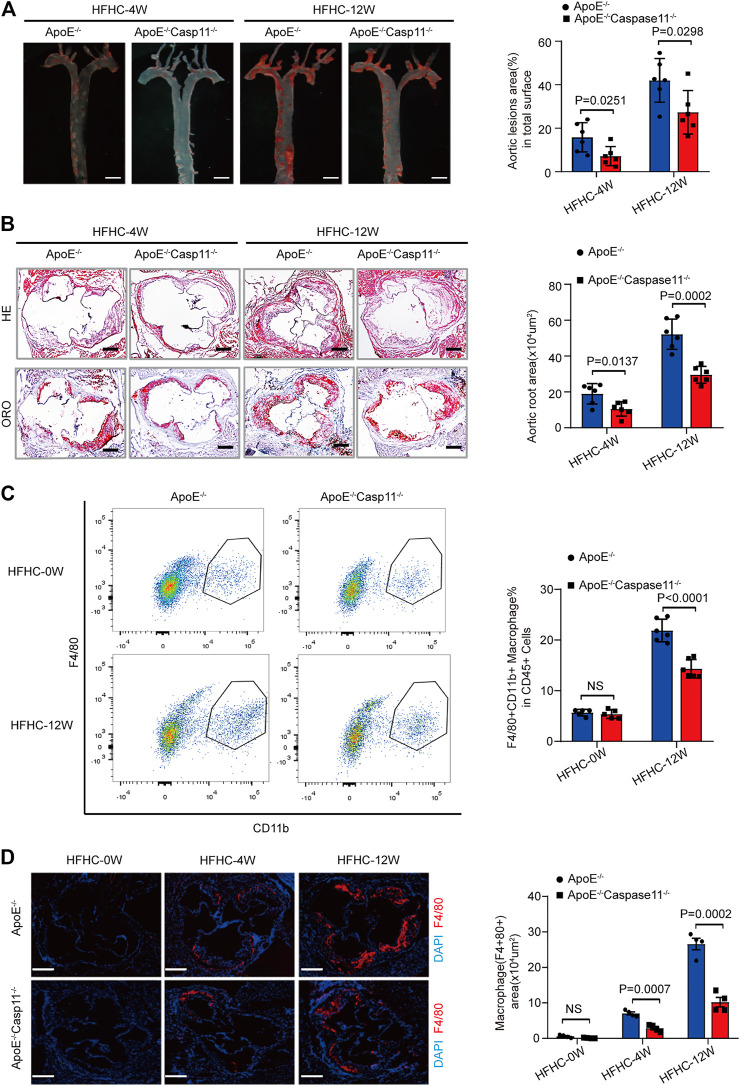
FIGURE 3.
Genetic deletion of caspase-11 attenuated atherosclerosis plaque progression and macrophage infiltration in ApoE−/− mice. (A) Left, overall comparison of representative whole-aortas stained with Oil-Red-O staining (n = 5 mice per group; scale bar, 1 mm). Right, quantitative results of the stained area in the entire aortas in ApoE−/− and ApoE−/−Caspase-11−/− mice with 4 or 12-week HFHC diet. (B) Left, histological analysis of aortic root sections stained with H&E and ORO staining in the aortic root sections in ApoE−/− and ApoE−/−Caspase-11−/− mice after 4 or 12-week HFHC diet (n = 5 mice per group; scale bar, 100 μm). Right, quantitative results for the lesion formation in the aortic root sections in the indicated groups (n ≥ 20 fields per group). (C) Left, flow cytometric analysis of aortic macrophage content, determined as F4/80+CD11b+ cells per aorta and statistical results for aortic macrophage content in ApoE−/− and ApoE−/−Caspase-11−/− mice after 0 and 12-week HFHC diet treatment (n = 5 mice per group). Right, quantitative results of flow cytometric analysis. (D) Left, representative images of F4/80 (red) and DAPI (blue) in aortic root sections in ApoE−/−, ApoE−/−Caspase-11−/− mice after 0, 4 and 12-week of HFHC treatment (n = 5 mice per group; scale bar, 100 μm). Right, quantification analysis of the F4/80 positive area of aortic root sections in the indicated groups (n ≥ 20 fields per group). Data shown are mean ± SD (A–D). Data were first analyzed and passed normality test (Shapiro-Wilk test). p values were shown and assessed by Mann-Whitney test (A–D). All of the p values were labeled on the pictures and p < 0.05 was considered to indicate statistical significance. ORO, Oil-Red-O; H&E, hematoxylin and eosin; HFHC, High fat and high cholesterol.

