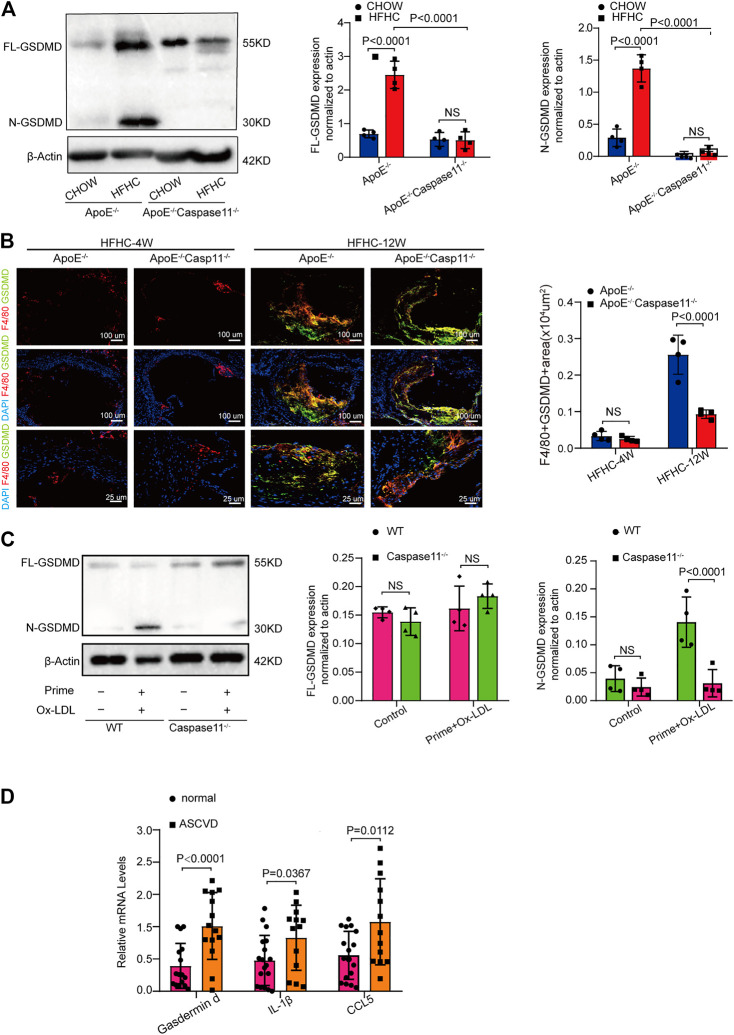
FIGURE 4.
Caspase-11 deficiency attenuates atherosclerosis via blocking the activation of gasdermin D in macrophage. (A) Left, representative western blot of the cleaved and total protein levels of gasdermin D in the aortas of WT, ApoE−/− and ApoE−/−Caspase-11−/− mice after twelve weeks of chow diet or HFHC diet (n = 4 mice per group). Middle, quantitative analysis of the levels of N-GSDMD. Right, quantitative results of the protein levels of FL-GSDMD. (B) Left, representative images of gasdermin D (green), F4/80 (red) and DAPI (blue) of the F4/80 and gasdermin D positive area of aortic root sections in ApoE−/− and ApoE−/−Caspase11−/− mice after 4 and 12 weeks of HFHC diet (n = 4 per group). Right, quantification analysis of the F4/80 and gasdermin D positive area of aortic root sections in the indicated groups (n ≥ 20 fields per group). (C) Left, the protein expression of the cleaved and total protein levels of gasdermin D in peritoneal macrophage from WT and caspase-11−/− mice primed with LPS for 5 h and then treated with ox-LDL for 16 h after LPS administration was determined by western blotting. Middle, quantitative analysis of the levels of N-GSDMD. Right, quantitative results of the protein levels of FL-GSDMD (n = 4 samples per group). (D) The quantification of gasdermin D, IL-1β, CCL5 mRNA levels in peripheral blood monocytes in patients with coronary heart diseases and the control group (n = 10 per group). Data shown are mean ± SD (A–D). Data were first analyzed and passed normality test (Shapiro-Wilk test). p values were shown and assessed by one-way ANOVA with Tukey’s test (A), by Mann-Whitney test (B, C) and by unpaired two-tailed t test (D). All of the p values were labelled on the pictures and p < 0.05 was considered to indicate statistical significance. GSDMD, gasdermin D.

