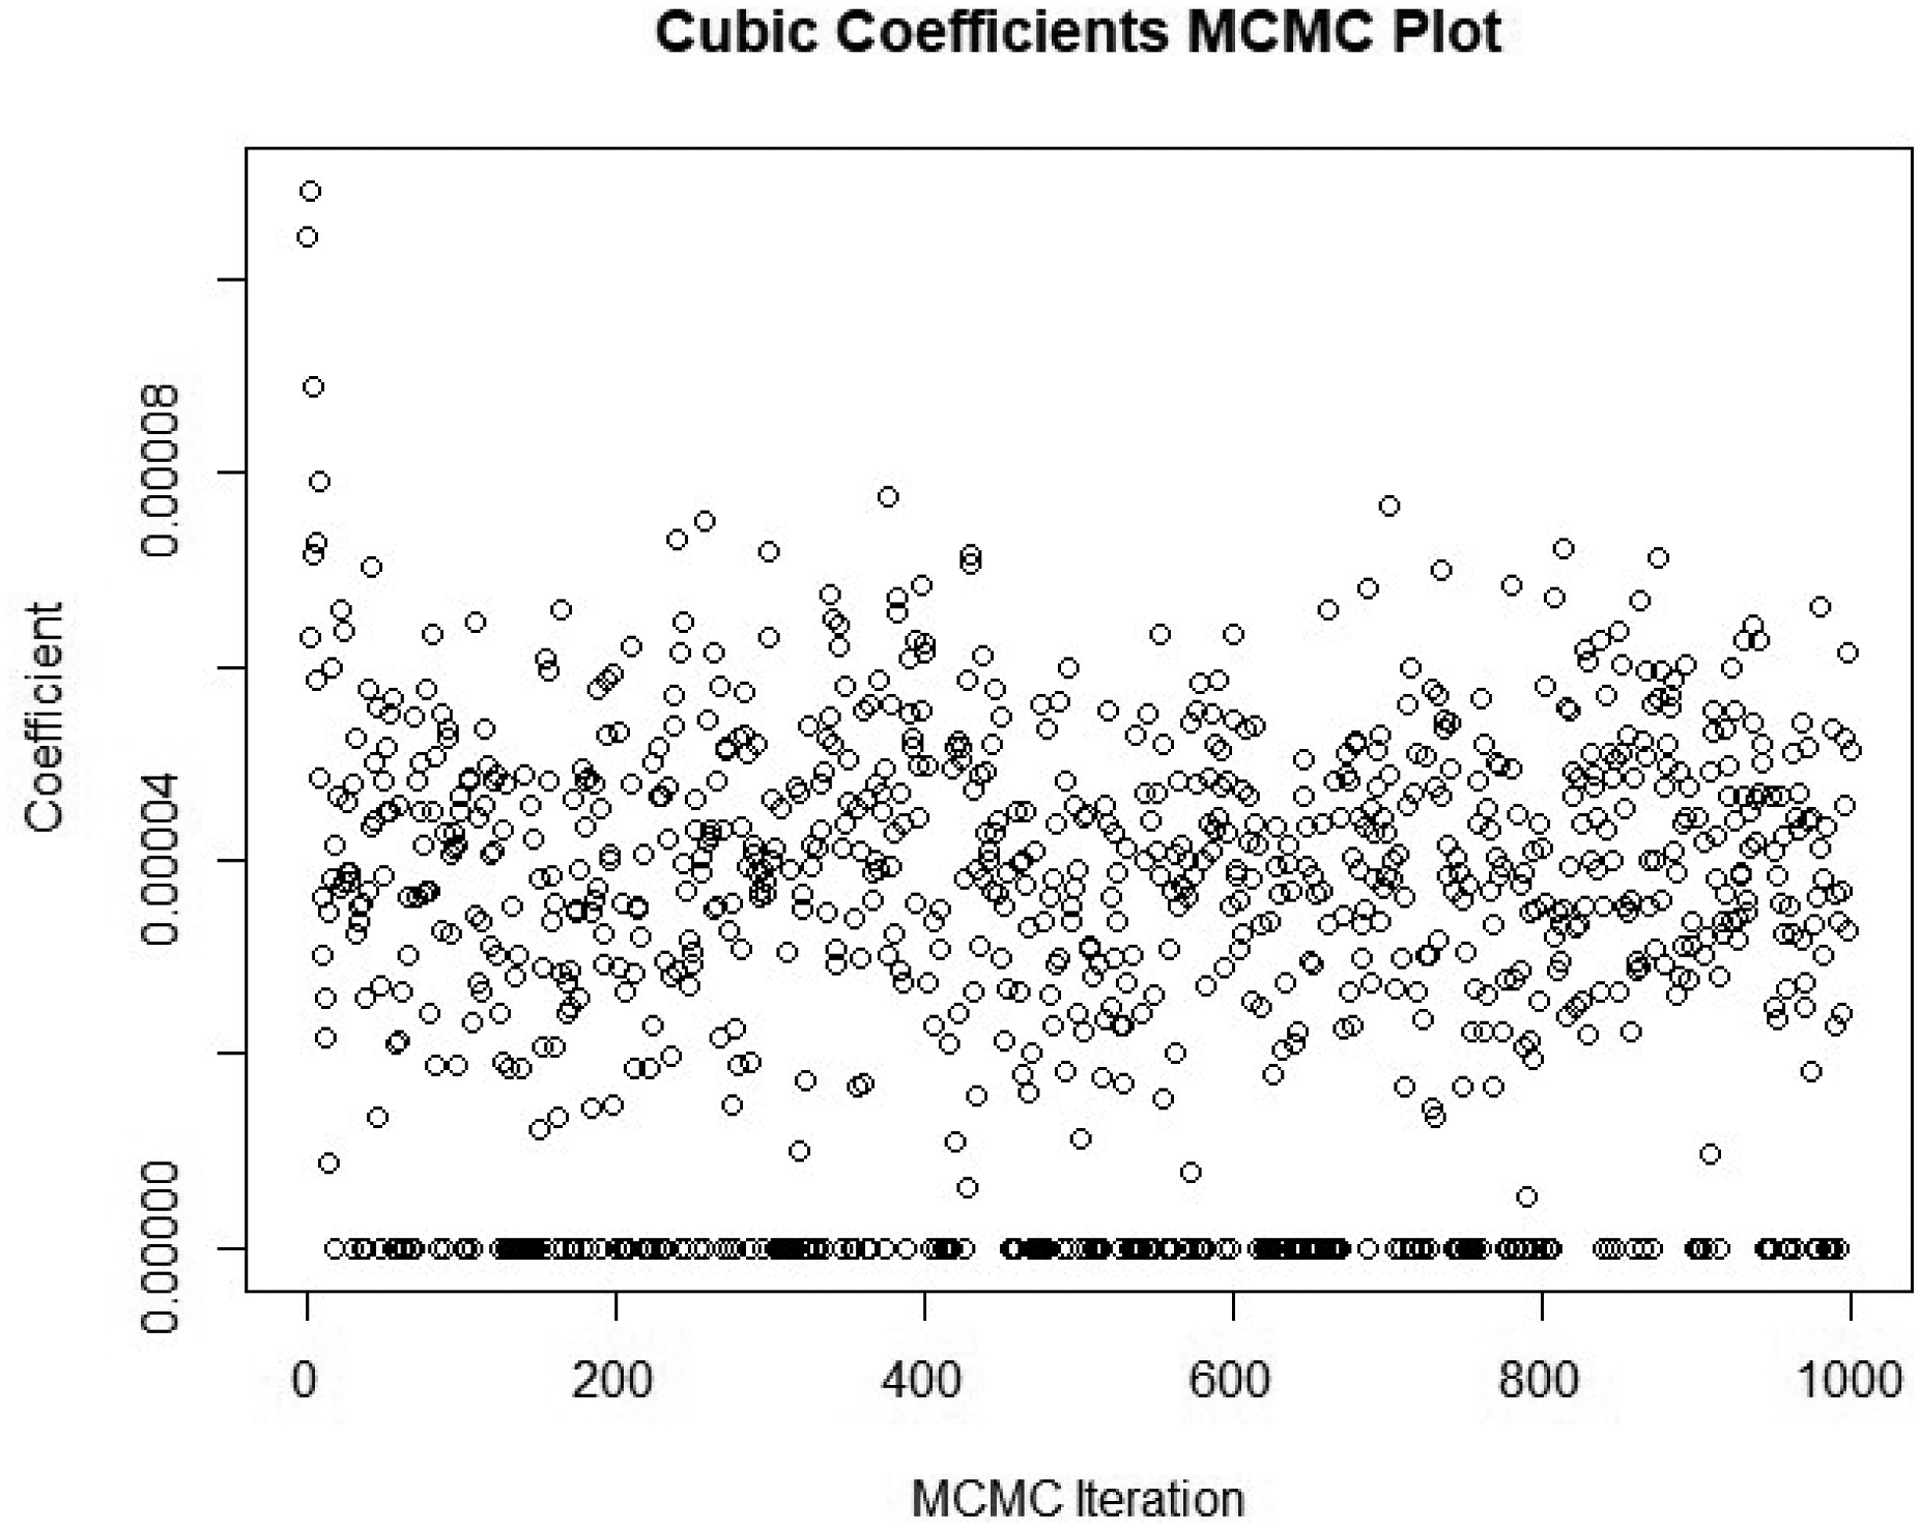
Figure 4:

Example of MCMC Samples for Cubic Term with Model Selection
Note: This discretized version of a traceplot corresponds to the first 1,000 MCMC iterations for the cubic coefficient in the son’s “Upper” group. The cluster of zeros show the draws where the cubic term is selected out of the model.
