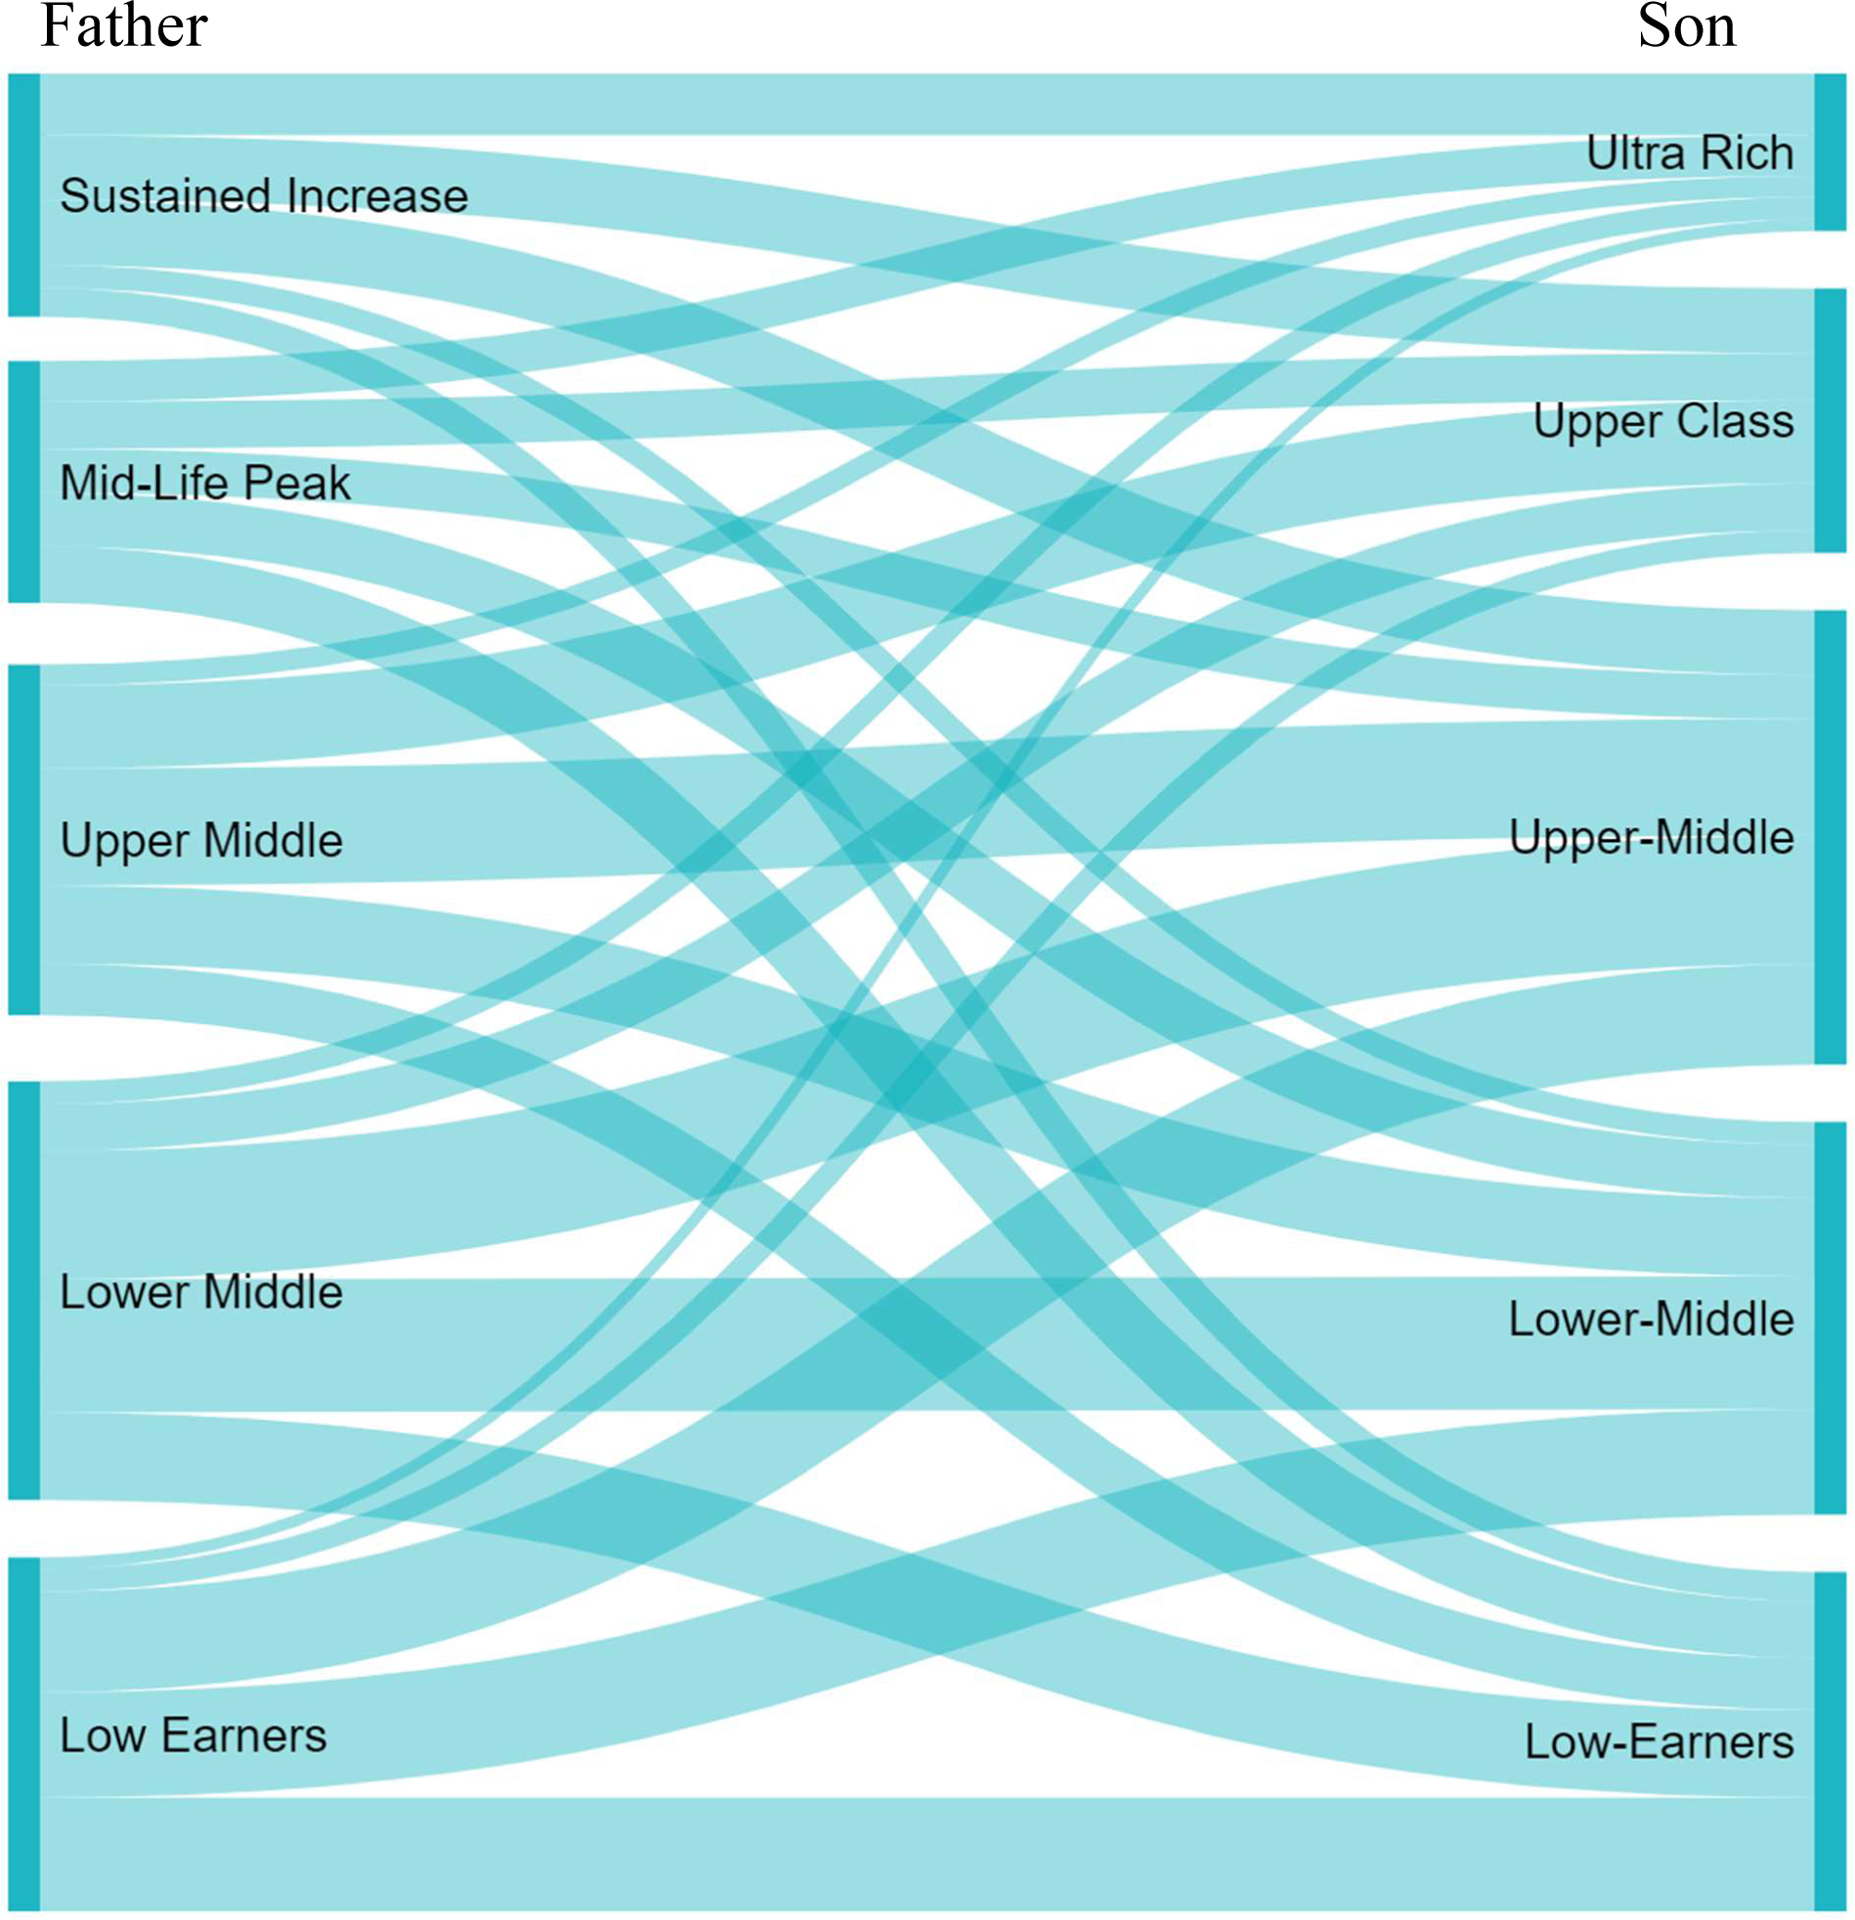
Figure 6:

Sankey Diagram of Group Membership Transitions
Note: Groups are labeled in accordance with Table 4. The data used to make this figure come from the reported posterior medians of the group membership probabilities using data from the Panel Study of Income Dynamics 1968–2017. The width of the five blocks on the left correspond to fathers’ group membership probabilities. The width of the five blocks on the right correspond to sons’ group membership probabilities. The width of the five segments emanating out of each block correspond to transition probabilities. The width of a segment as a proportion of the total height of the figure corresponds to the joint probability.
