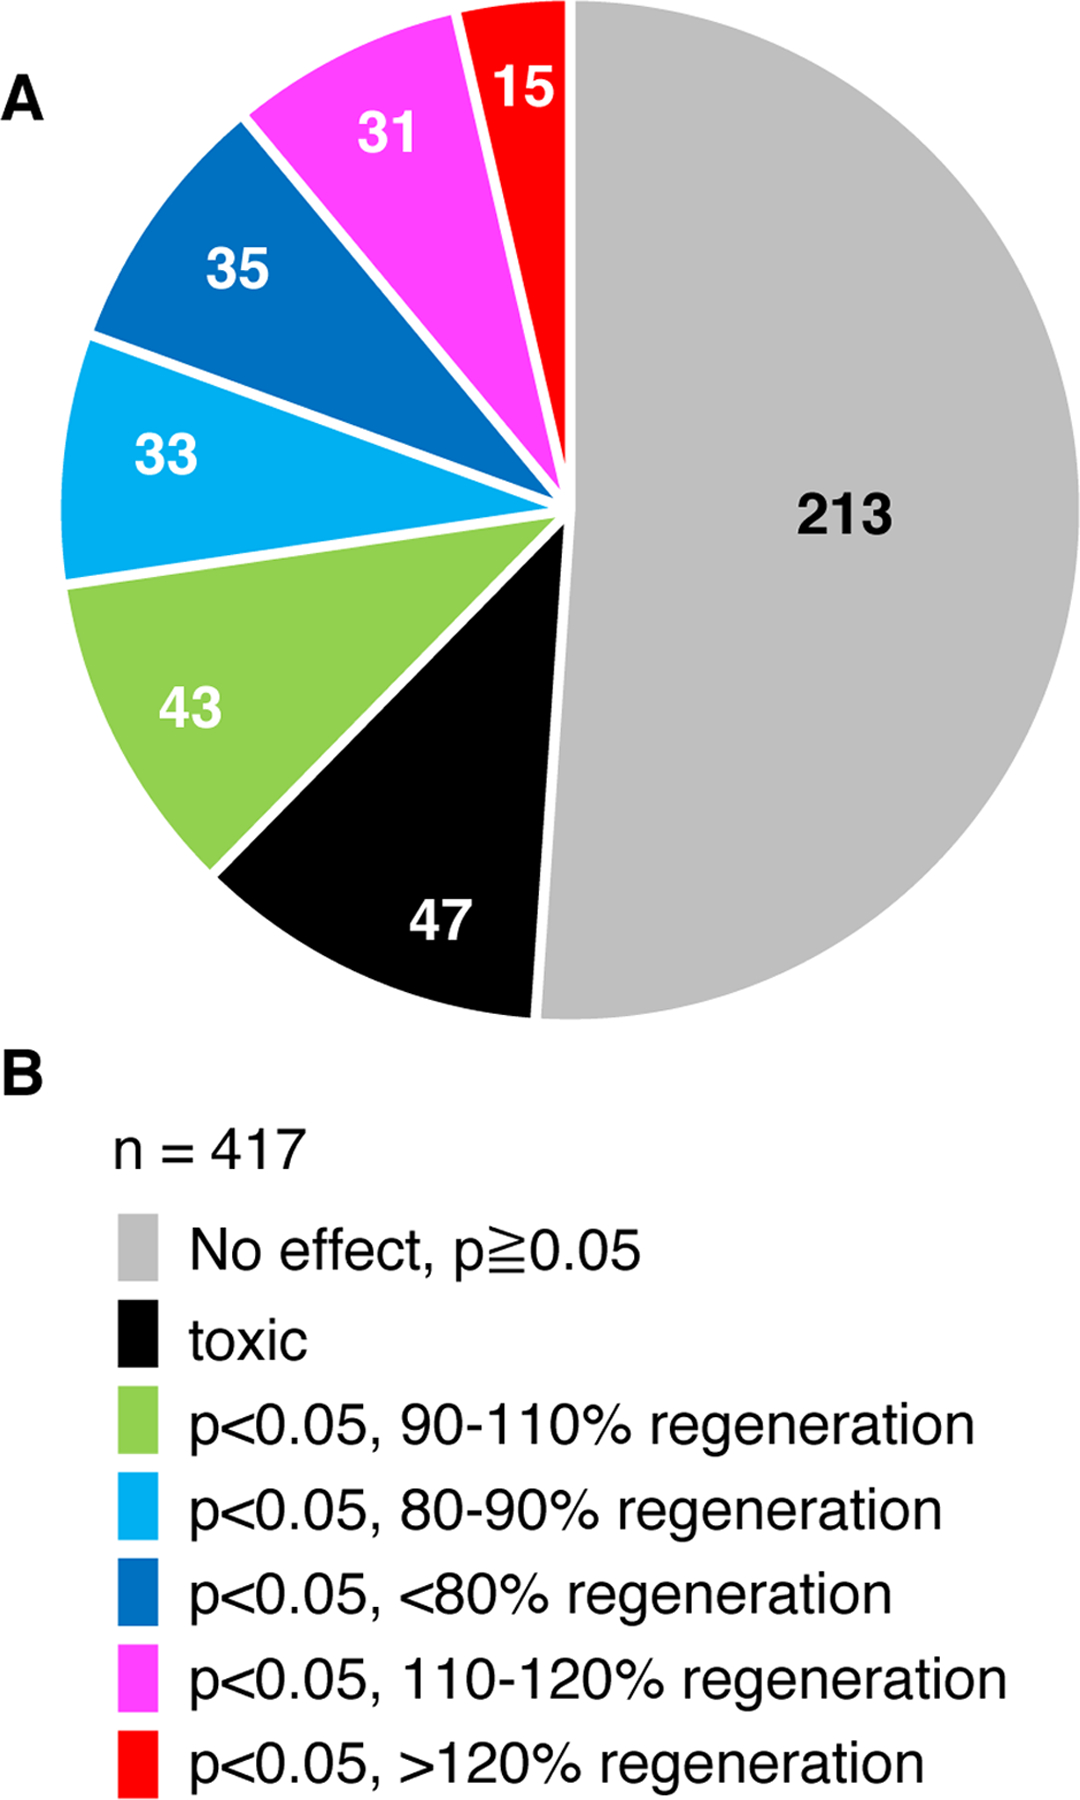
Fig. 2. Summary of larvae fin regeneration screening.

(A) Summary of experiments with 429 unique compounds are shown as a pie chart. The number in each fraction shows the number of fractions or purified compounds.
(B) Color-coding of the results shown in A.
