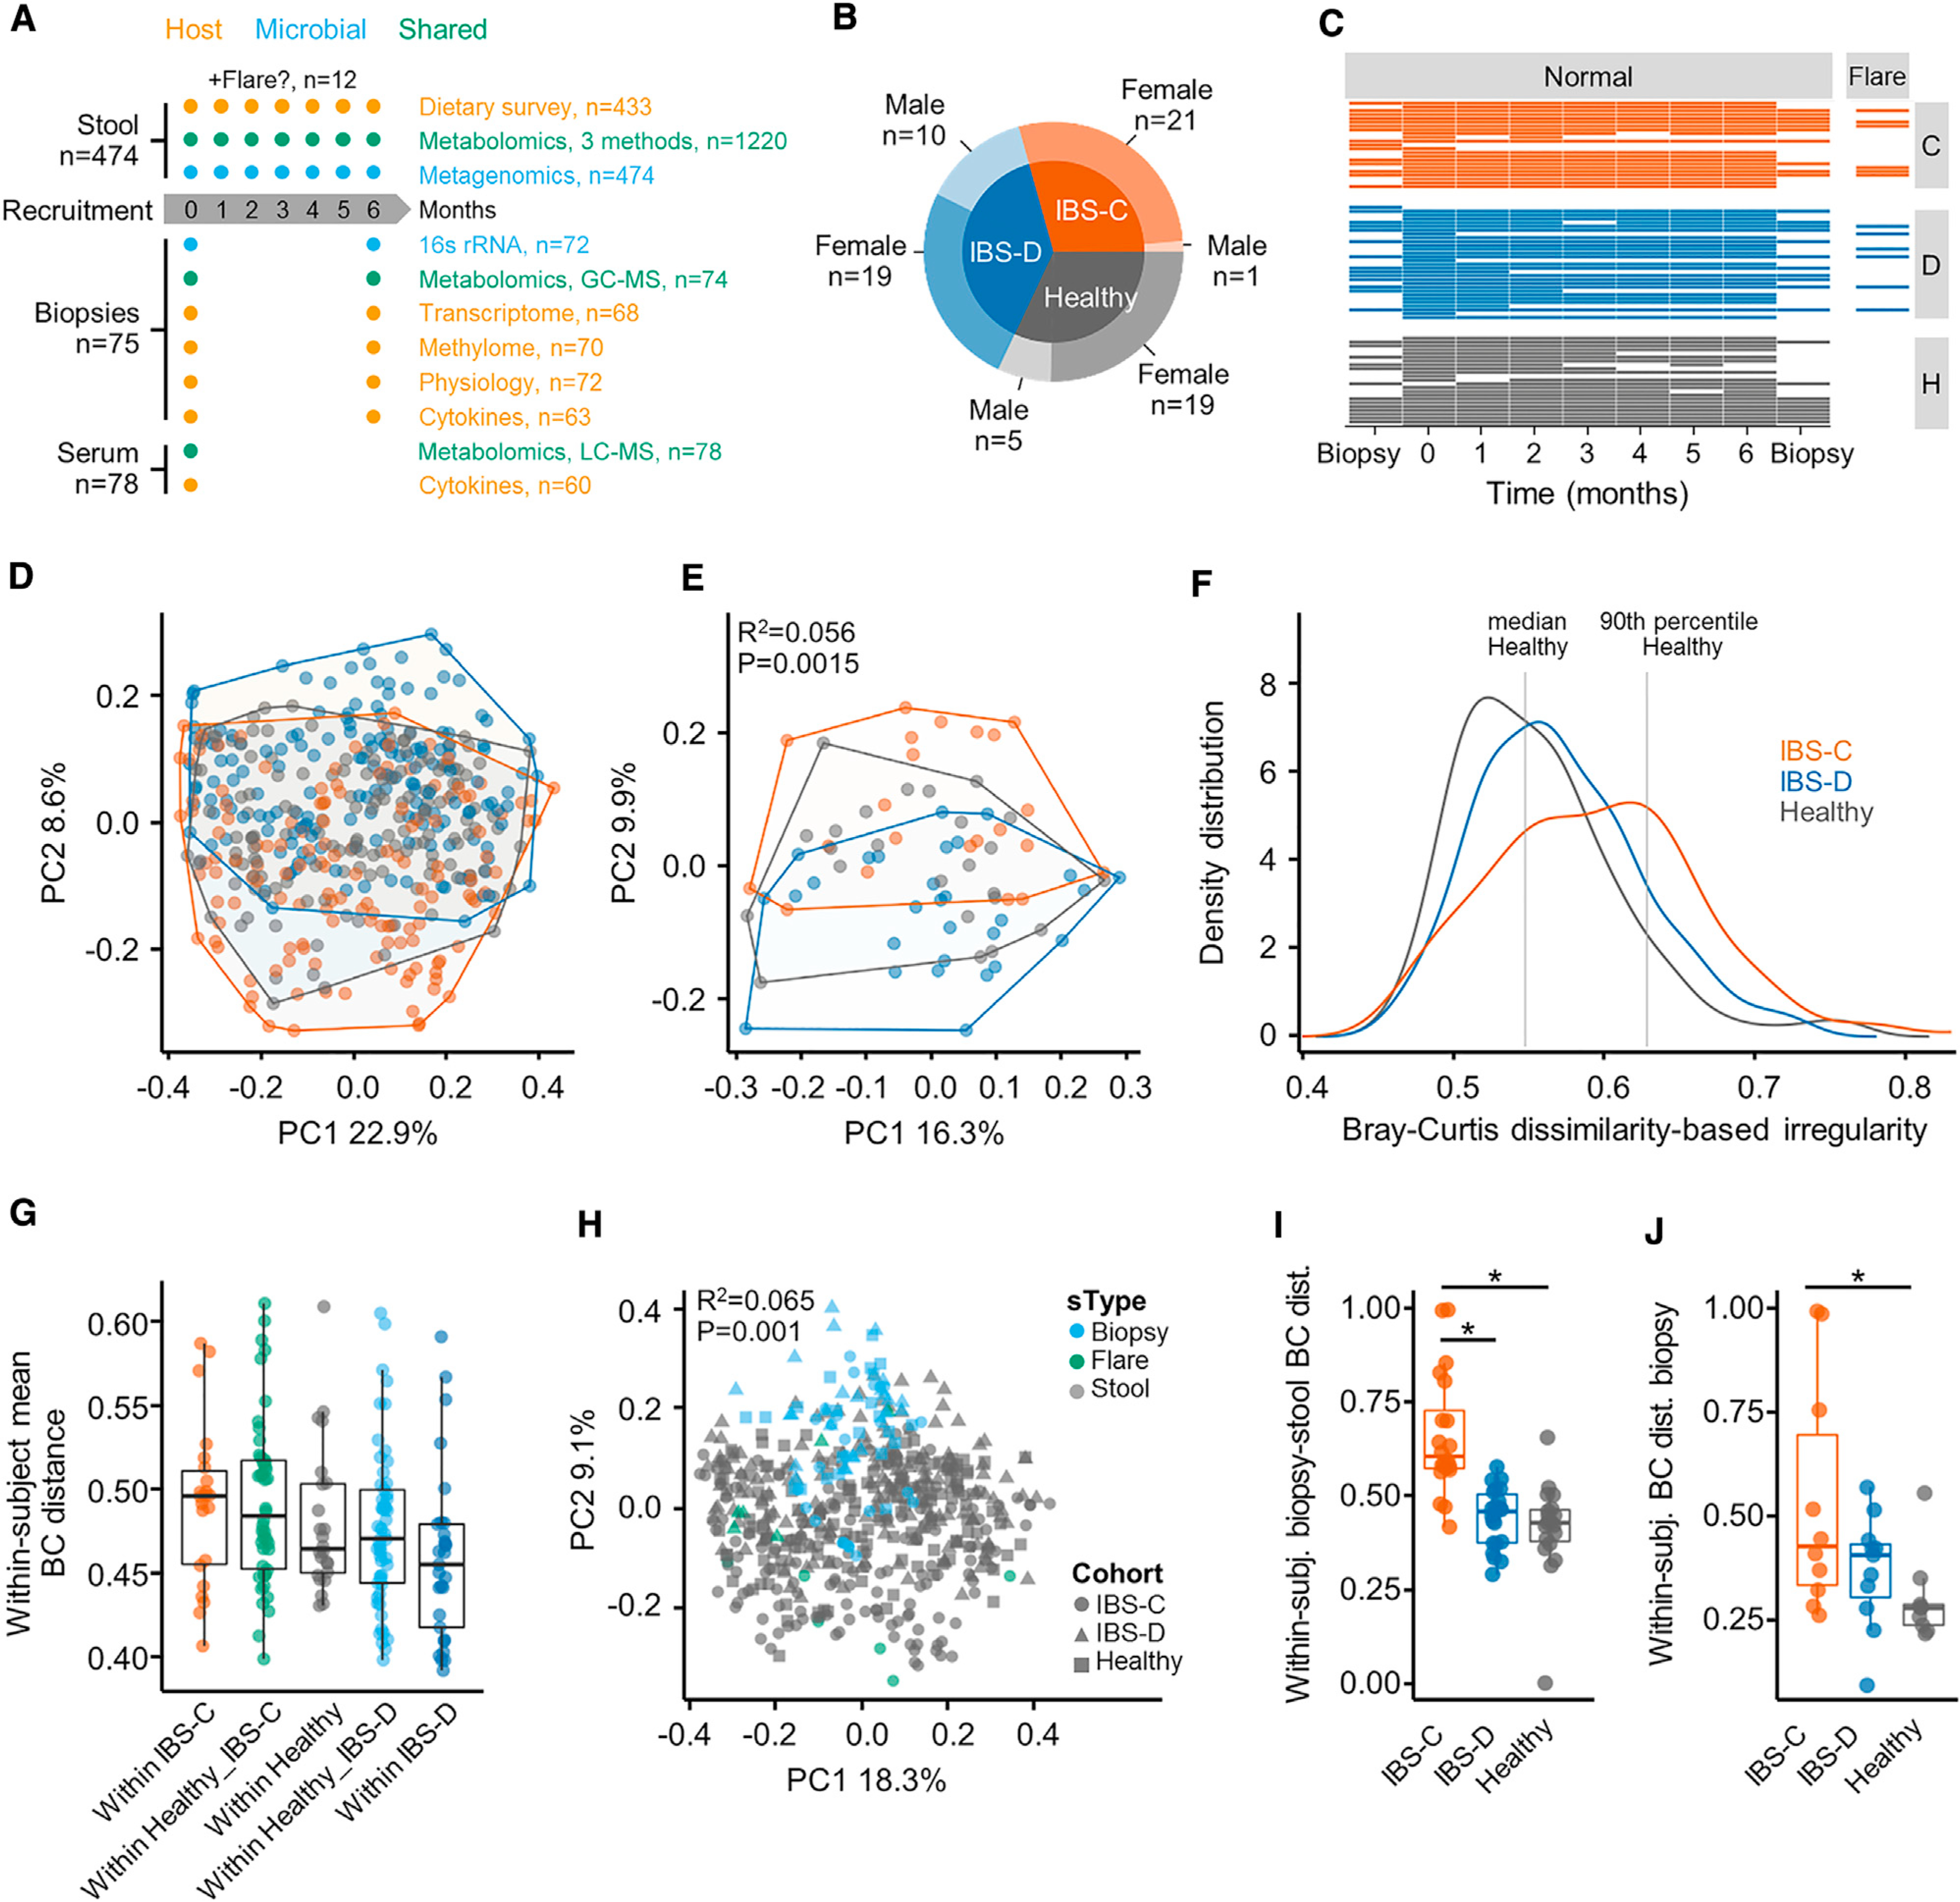
Figure 1. Gut Microbiota Composition of IBS-C Patients Is More Distinct and Variable.

(A) Outline of sample collection.
(B) Number of subjects and distribution of biological sex by cohort.
(C) Total number of samples per subject collected longitudinally.
(D) Bray Curtis β-diversity ordination of samples from IBS-C, IBS-D, and HC considering all samples from all subjects (n = 474 stool samples, no. of samples per subject 1–7).
(E) Same as (D) considering by-subject averaged data (statistics in inset from PERMANOVA on group membership). IBS-C and IBS-D versus HC, p = < 0.05, IBS-C versus IBS-D, p value = 0.001, dispersion around centroids via pairwise PERMANOVA (n = 22, 29, and 24 averaged gut microbiome profiles for IBS-C, IBS-D, and HC, respectively).
(F) Bray-Curtis dissimilarity (BCD)-based irregularity (BCDI) showing distribution of the three groups linear mixed-effect model correcting for subject HC versus IBS-C p = < 0.011 (n = 142, 170, and 143 stool samples for IBS-C, IBS-D, and HC, respectively).
(G) Community variability determined by the mean within-subject Bray Curtis distance (within-IBS-D versus within-IBS-C, p = < 0.005, ANOVA Tukey, n = 22, 46, 24, 53, and 29, Bray-Curtis distances between stool samples of the same subject for within-IBS-C, Healthy versus IBS-C, within-Healthy, Healthy versus IBS-D, and within-IBS-D, respectively).
(H) Bray Curtis β-diversity ordination of biopsy and stool samples (statistics in inset from PERMANOVA on group membership. n = 72, 12, and 462 stool samples for biopsy, flare, stool, respectively).
(I) Difference in mucosa associated and luminal microbiota composition based on Bray-Curtis distance (HC versus IBS-C, IBS-D versus IBS-C p = < 0.001, ANOVA Tukey HSD; n = 20, 22, and 19 paired mucosal-stool microbiome samples for IBS-C, IBS-D, and HC, respectively).
(J) Community variability within each group based on mean Bray Curtis Distance (HC versus IBS-C, p value = 0.02, ANOVA Tukey HSD, n = 10, 11, and 9 mucosal microbiome samples for IBS-C, IBS-D, and HC, respectively).
Boxplot center represents median and box interquartile range (IQR). Whiskers extend to most extreme data point <1.5 × IQR. C: IBS-C, D: IBS-D, H: HC. Symbols indicate significance (*p = < 0.05).
See also Figures S1 and S2 and Tables S1 and S2.
