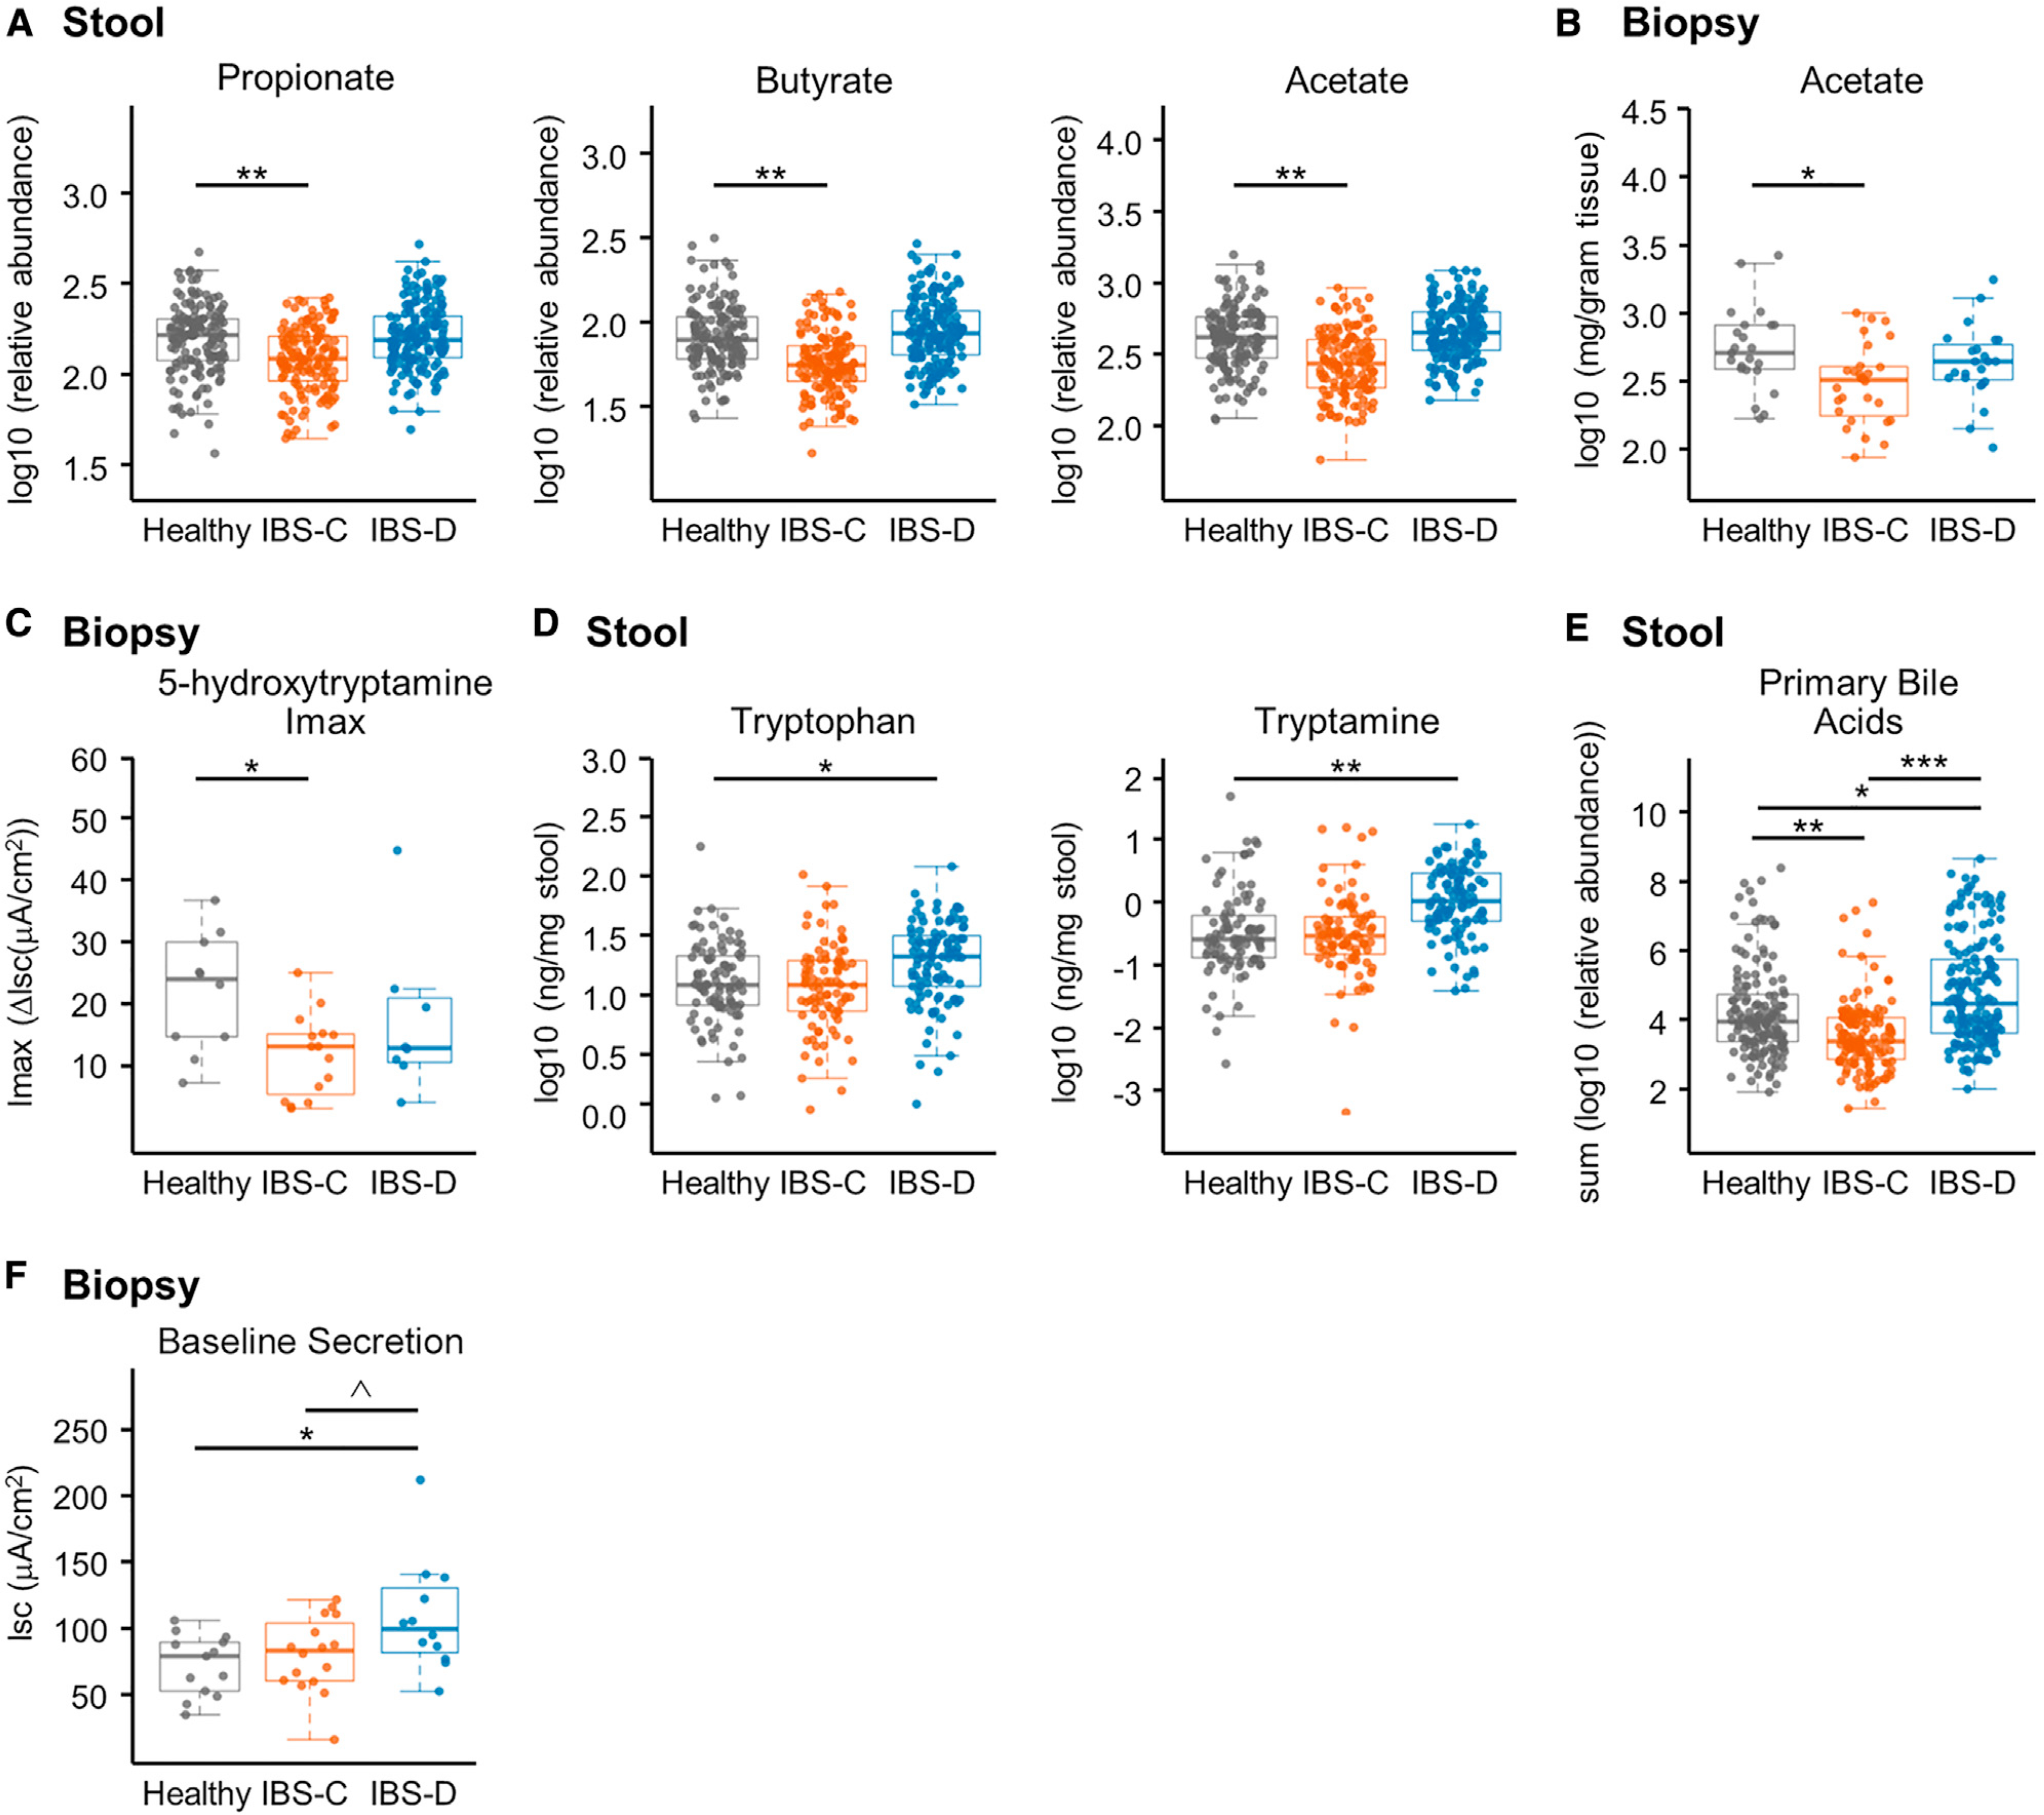
Figure 2. Metabolomics Integrated with Physiologic Measurements Provides Mechanistic Insight into the Effect of Gut Microbiota Metabolism on Gastrointestinal Function.

(A) Relative abundance of propionate, butyrate, and acetate in stool samples determined with 1H NMR (linear mixed-effect models on log10-transformed data correcting for subject, FDR corrected, n = 136, 170, and 146 metabolite profiles for IBS-C, IBS-D, and HC, respectively).
(B) Absolute abundance of acetate in colonic biopsies determined with GC-MS (linear mixed-effect models on log10-transformed abundance correcting for subject, FDR corrected, n = 28, 23, and 23 averaged metabolomes for IBS-C, IBS-D, and HC, respectively).
(C) Maximal ΔIsc (Imax) following application of increasing concentrations of serotonin (5-HT) basolaterally in colonic biopsies from time-point 1 (ANOVA Tukey HSD, n = 13, 12, and 10 colonic biopsies for IBS-C, IBS-D, and HC, respectively).
(D) Absolute abundance of tryptophan and tryptamine in a subset of the stool samples determined with LC-MS/MS (ng/mg stool) (linear mixed-effect models on log10-transformed data correcting for subject, FDR adjusted, n = 84, 91, and 103 metabolite profiles for IBS-C, IBS-D, and HC, respectively).
(E) Relative abundance of primary unconjugated bile acids in stool samples determined with LC-MS/MS. Data shown are the sum of cholic acid and chenodeoxycholic acid relative abundances (linear mixed-effect models on log10-transformed data correcting for subject, n = 136, 170, and 146 metabolite profiles for IBS-C, IBS-D, and HC, respectively).
(F) Baseline Isc (ANOVA Tukey HSD, n = 16, 12, and 13 colonic biopsies for IBS-C, IBS-D, and HC, respectively).
Boxplot center represents median and box IQR. Whiskers extend to most extreme data point <1.5 × IQR. Symbols indicate significance (***p = < 0.001, **p = < 0.01, *p = < 0.05, ^p = < 0.10).
