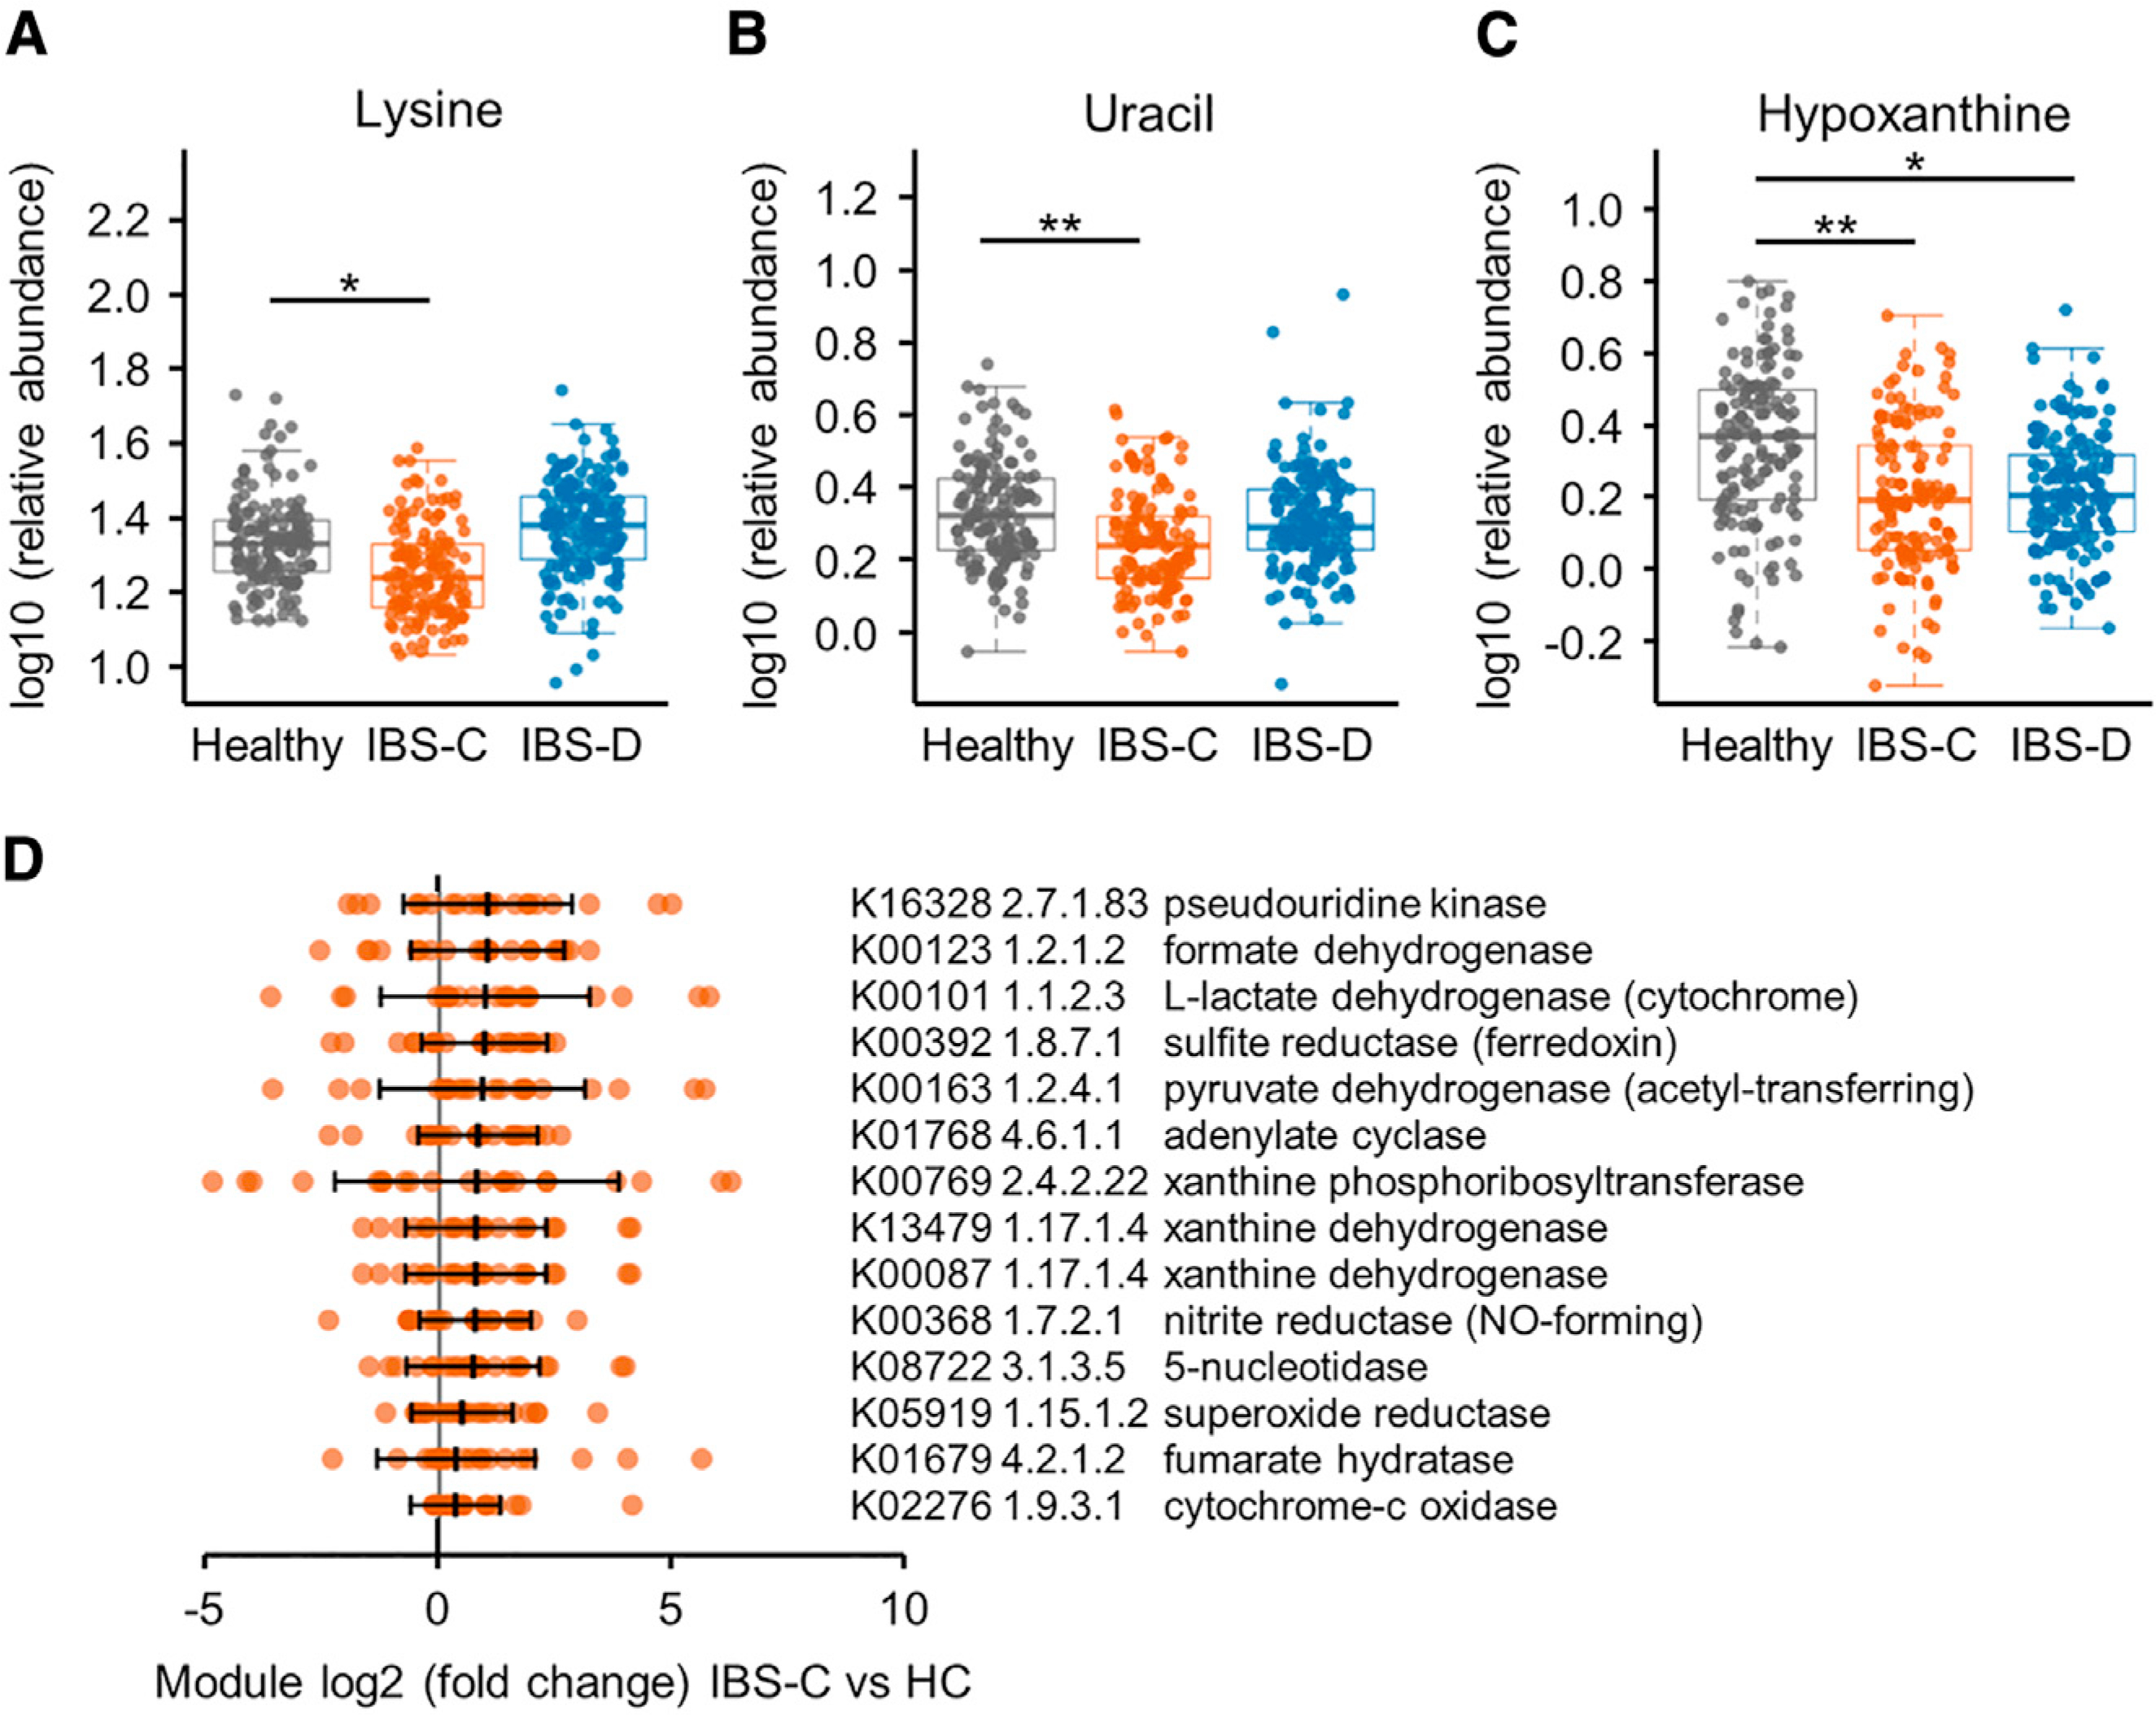
Figure 3. Integrated Microbiome-Metabolome Analysis Identifies a Novel Microbial Metabolic Pathway in IBS.

(A–C) Relative abundance of (A) lysine, (B) uracil, and (C) hypoxanthine in stool samples determined with 1H NMR (linear mixed-effect models on log10-transformed data correcting for subject, FDR adjusted, n = 136, 170, and 146 metabolite profiles for IBS-C, IBS-D, and HC, respectively). Boxplot center represents median and box IQR. Whiskers extend to most extreme data point <1.5 × IQR. Symbols indicate significance (***p = < 0.001, **p = < 0.01, *p = < 0.05).
(D) Selected hypoxanthine-related gut metagenome KO term abundance in stools from IBS-C subjects compared to the median abundance of the healthy control (HC) subjects. By-subject averaged data (FDR <0.1, Mann-Whitney test; except for K00769, which had q value 0.12). The maximal log2(FC) of the either of the xanthine dehydrogenase (XDH)/oxidase modules is 0.73, p = < 0.005, q value 0.09 for IBS-C, and log2(FC) 0.49, p = < 0.07 for IBS-D. Error bars show SD and middle line indicates median (IBS-C n = 22 averaged microbiome compositions). All KO term associations can be found in Table S3.
See also Figures S3 and S4 and Table S3.
