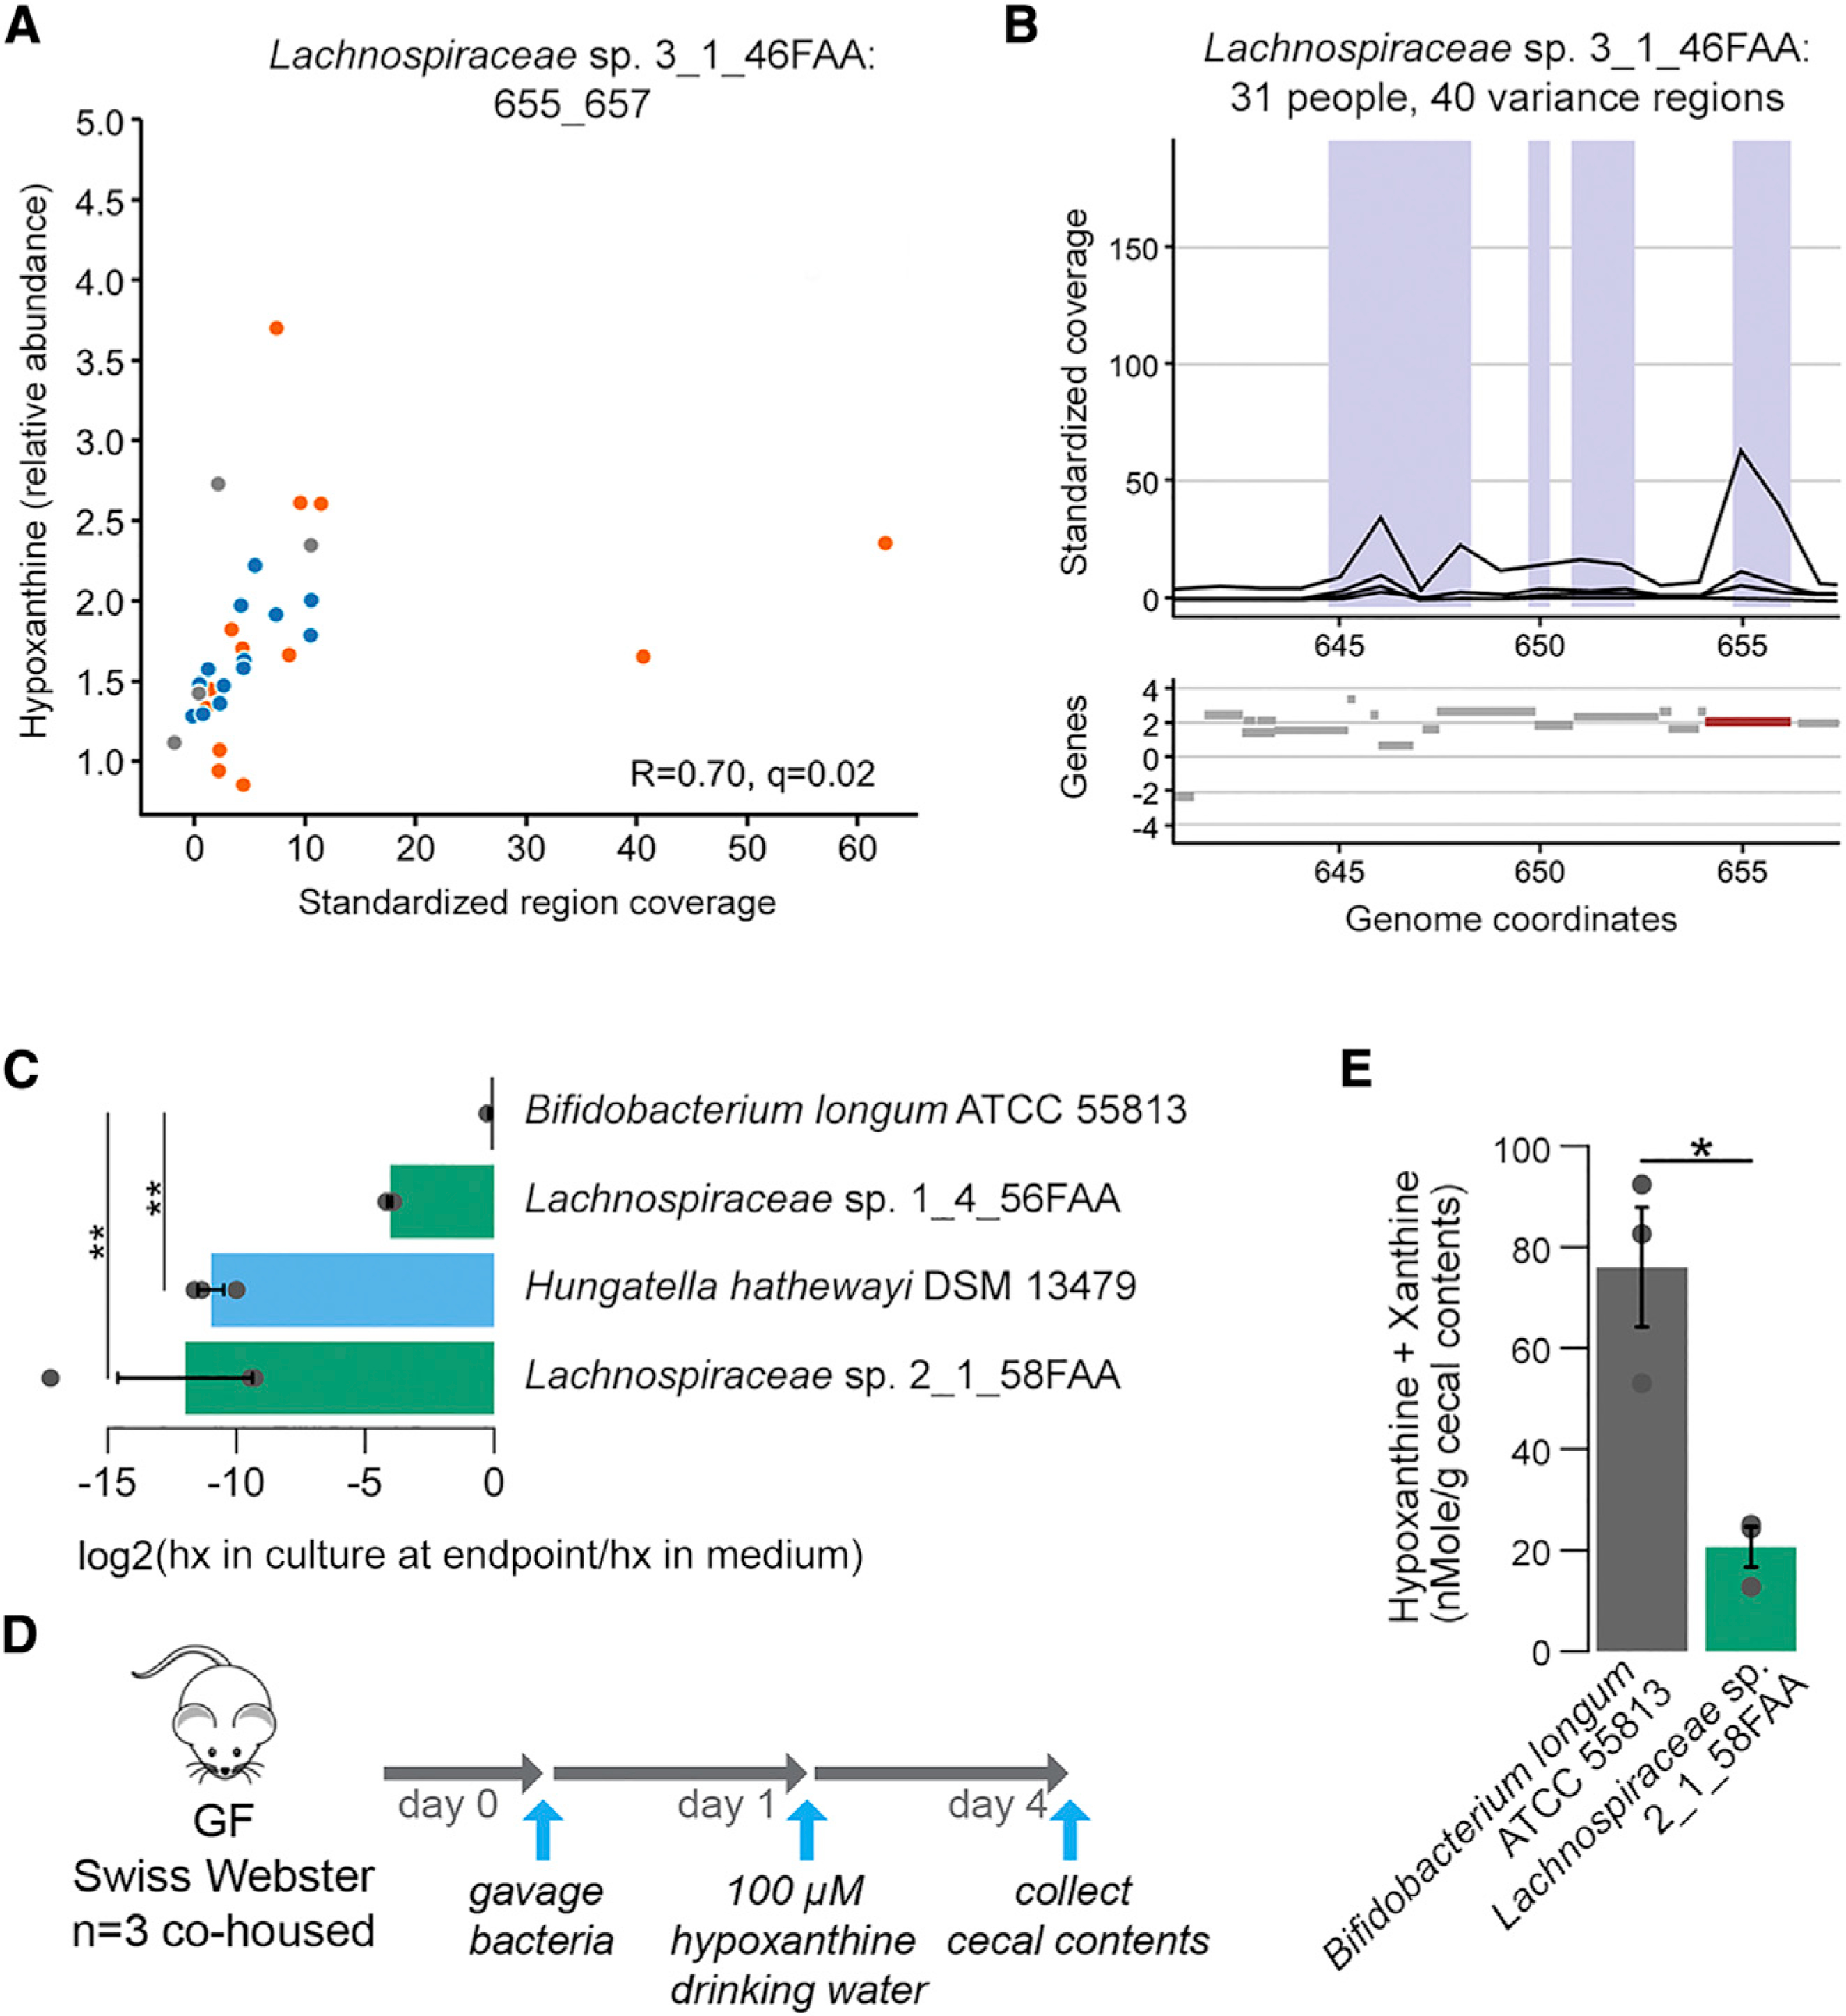
Figure 4. Hypoxanthine Consumption by Specific Gut Microbiome Members as Suggested by Microbial Gene Region Associations.

(A) Scatterplot of metabolite intensities and standardized region coverage for SV association result for Lachnospiraceae sp. 3_1_46FAA genomic region positively correlated to hypoxanthine (Spearman correlation inset, n = 13, 13, and 5 averaged microbiome abundances with Lachnospiraceae bacterium 3–146FAA present above threshold for IBS-C, IBS-D, and HC, respectively).
(B) Genomic context of region from (A) with relevant gene highlighted in red.
(C) 3 Clostridiales strains and B. longum were grown in Mega medium. Hypoxanthine levels in the culture supernatant after overnight growth were determined with LC-MS (ANOVA Tukey HSD on log2(FC), n = 3 cultures per strain). hx: hypoxanthine
(D) Outline of monocolonization mouse experiment verifying in vivo hypoxanthine consumption. 3 female GF Swiss Webster mice were oral gavaged with ~2*106 colony-forming units (CFUs) of either B. longum or Lachnospiraceae sp. 2_1_58FAA and co-housed for the duration of the experiment. Hypoxanthine was supplied in drinking water to mimic exogenous production by the microbiome. On day 4 after, gavage mice were sacrificed and cecal contents were collected.
(E) Hypoxanthine and xanthine pool size was determined in cecal contents using enzyme assays. Samples were corrected for baseline levels of H2O2 in the sample based on parallel reactions without XO enzyme (Welch t test on averaged duplicate samples, n = 3 cecal contents from 3 mice per colonization status).
Error bars indicate standard error of the mean (SEM). Symbols indicate significance (**p = < 0.01, *p = < 0.05).
