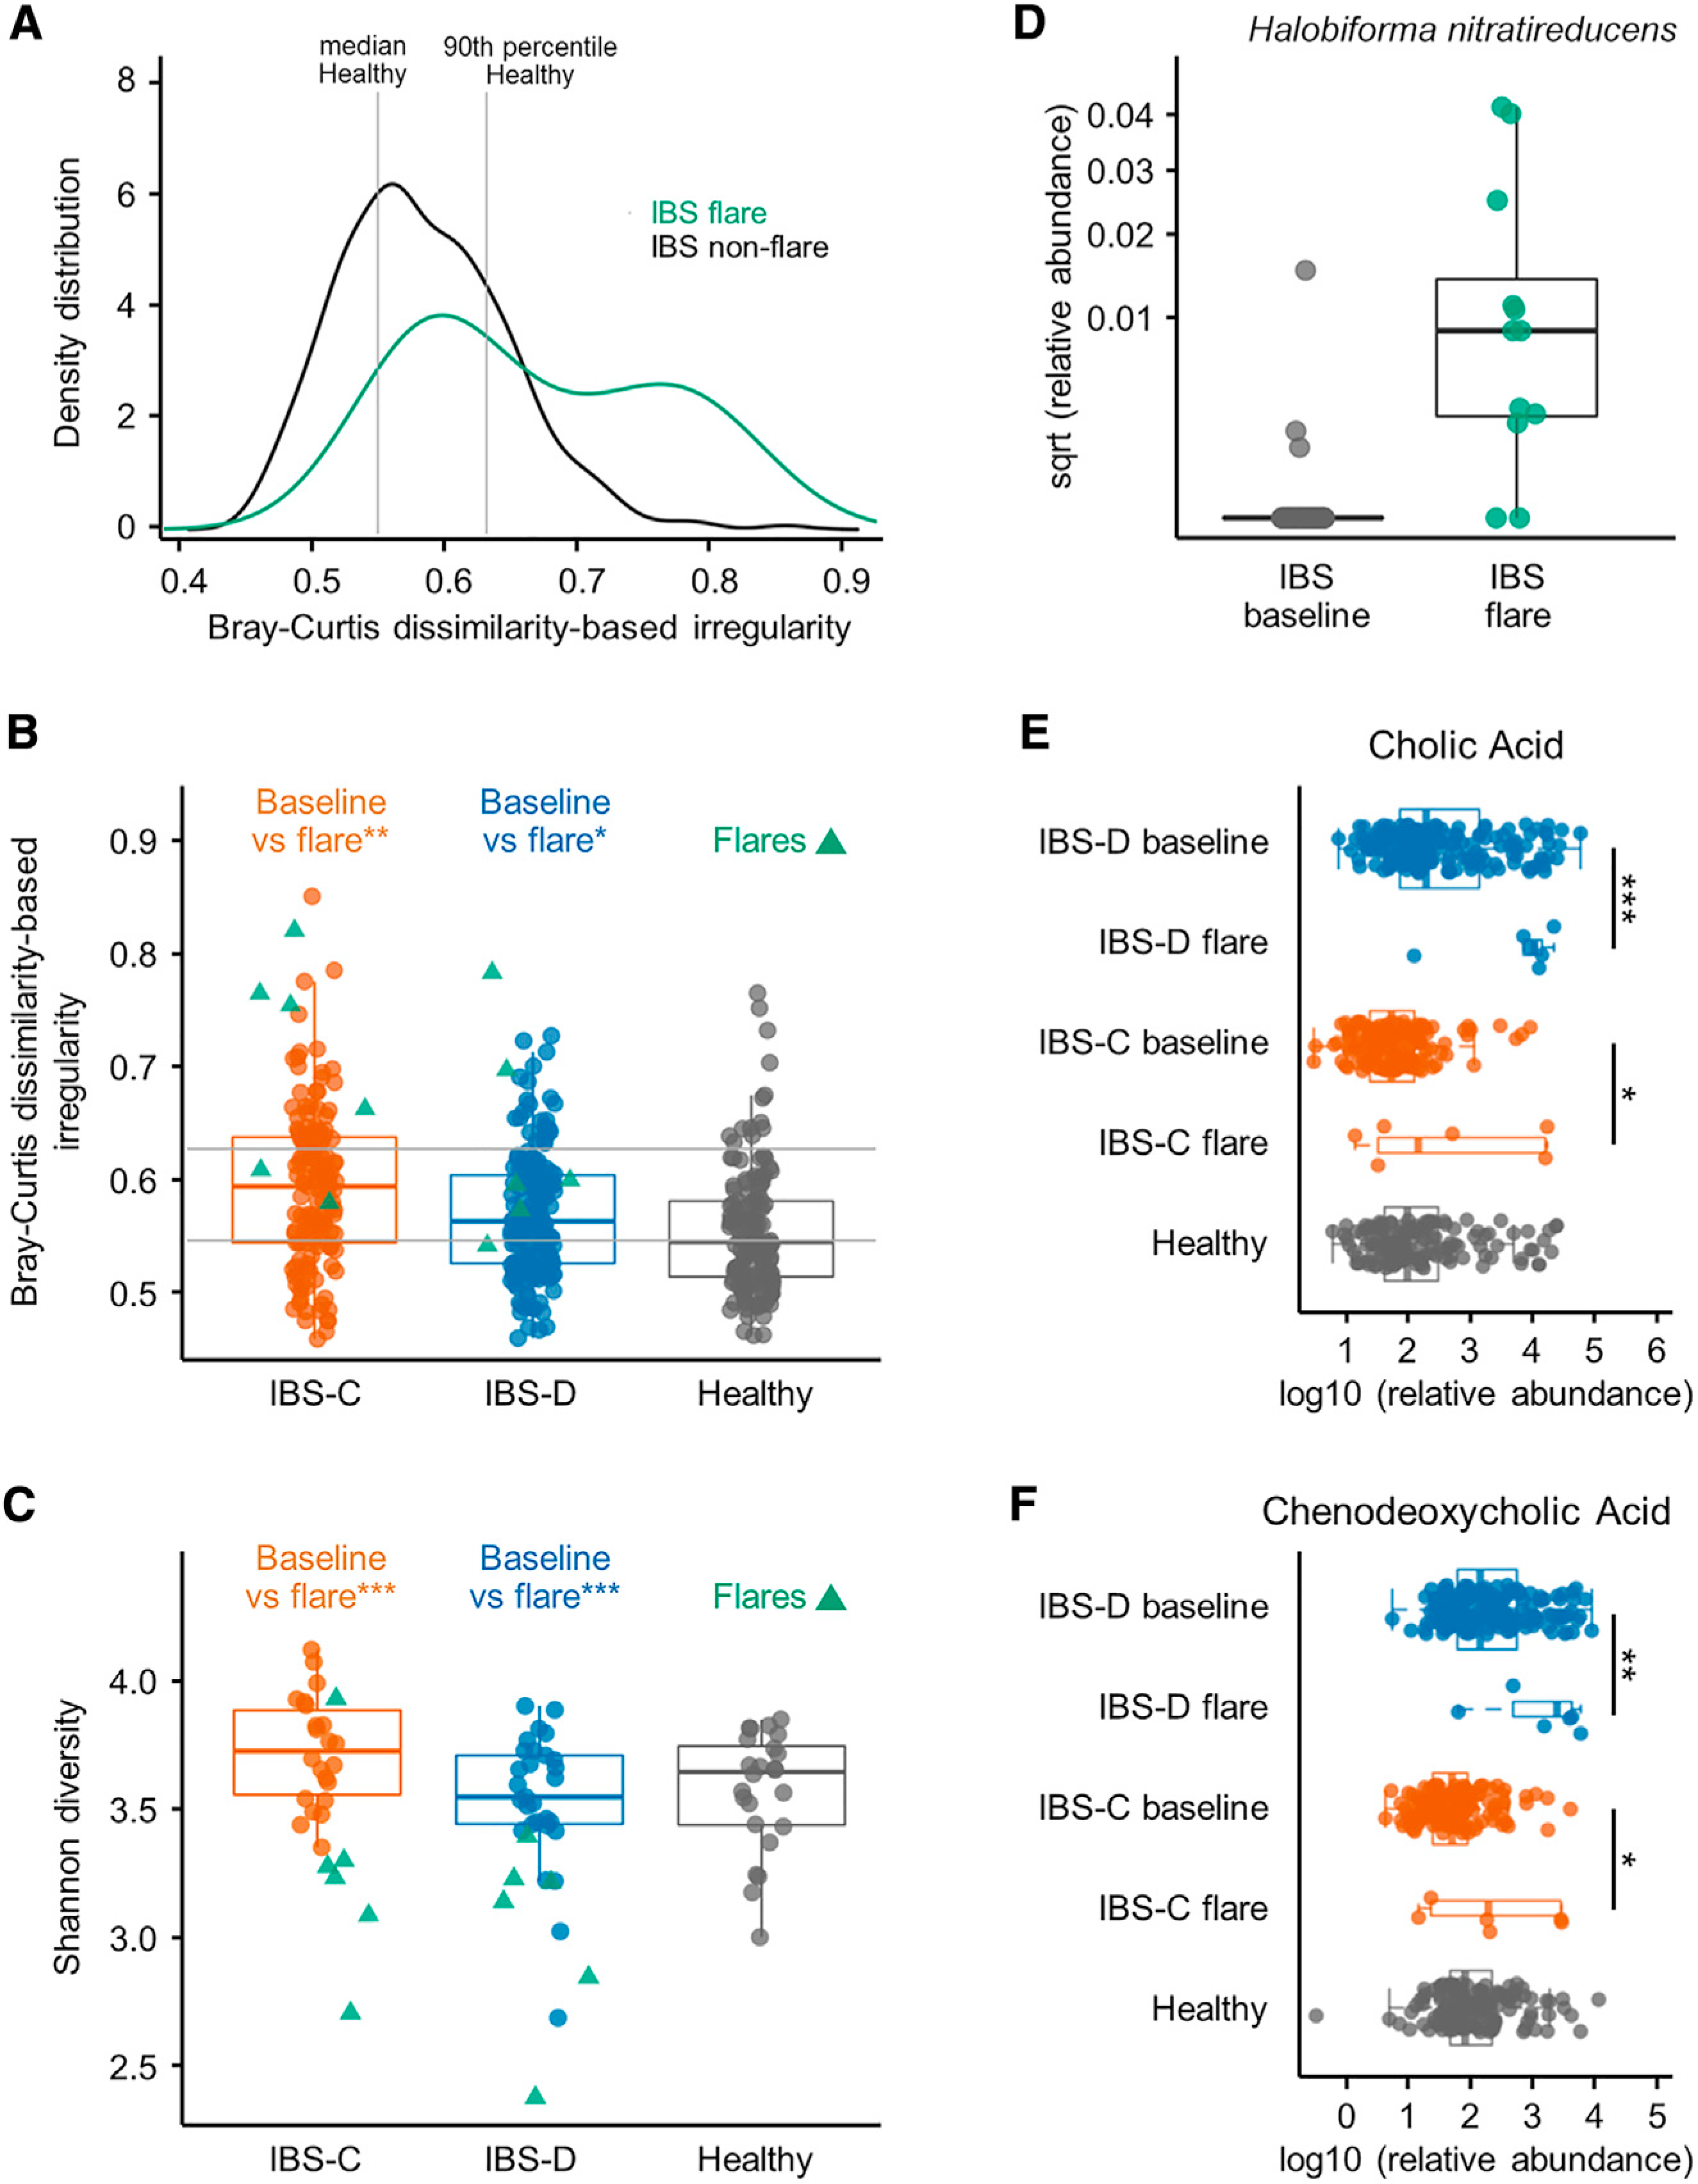
Figure 5. Alteration in Gut Microbiome and Microbial Metabolites Underlie Flares in IBS Patients.

(A) BCDI showing distribution of IBS flare and all non-flare IBS samples (linear mixed-effect model correcting for subject, IBS non-flare versus IBS flare p = < 0.01, n = 312, 12 gut microbiome profiles for IBS non-flare, IBS flare, respectively).
(B) Within-disease comparisons of BCDI score (p values from linear mixed-effect model correcting for subject, n = 142, 6, 170, and 6 gut microbiome profiles for IBS-C non-flare, IBS-C flare, IBS-D non-flare, and IBS-D flare, respectively).
(C) Within-disease comparisons of α-diversity in flare samples compared to by-subject averaged baseline data (Shannon diversity at species level, p values from Mann-Whitney U test, n = 22, 6, 29, and 6 averaged gut microbiome profiles for IBS-C non-flare, IBS-C flare, IBS-D non-flare, and IBS-D flare, respectively).
(D) Relative abundance of Halobiforma nitratireducens in flare and non-flare IBS samples (q < 0.001, Mann-Whitney U test, n = 51, 12 averaged gut microbiome profiles for IBS non-flare, IBS flare, respectively).
(E) Relative abundance of cholic acid in stool samples determined with LC-MS/MS (linear mixed-effect models on log10-transformed data correcting for subject, FDR adjusted, n = 136, 6, 170, and 6 metabolite profiles for IBS-C non-flare, IBS-C flare, IBS-D non-flare, and IBS-D flare, respectively).
(F) Same as in (E) for chenodeoxycholic acid.
Boxplot center represents median and box IQR. Whiskers extend to most extreme data point <1.5 × IQR. Symbols indicate significance (***p = < 0.001, **p = < 0.01, *p = < 0.05).
