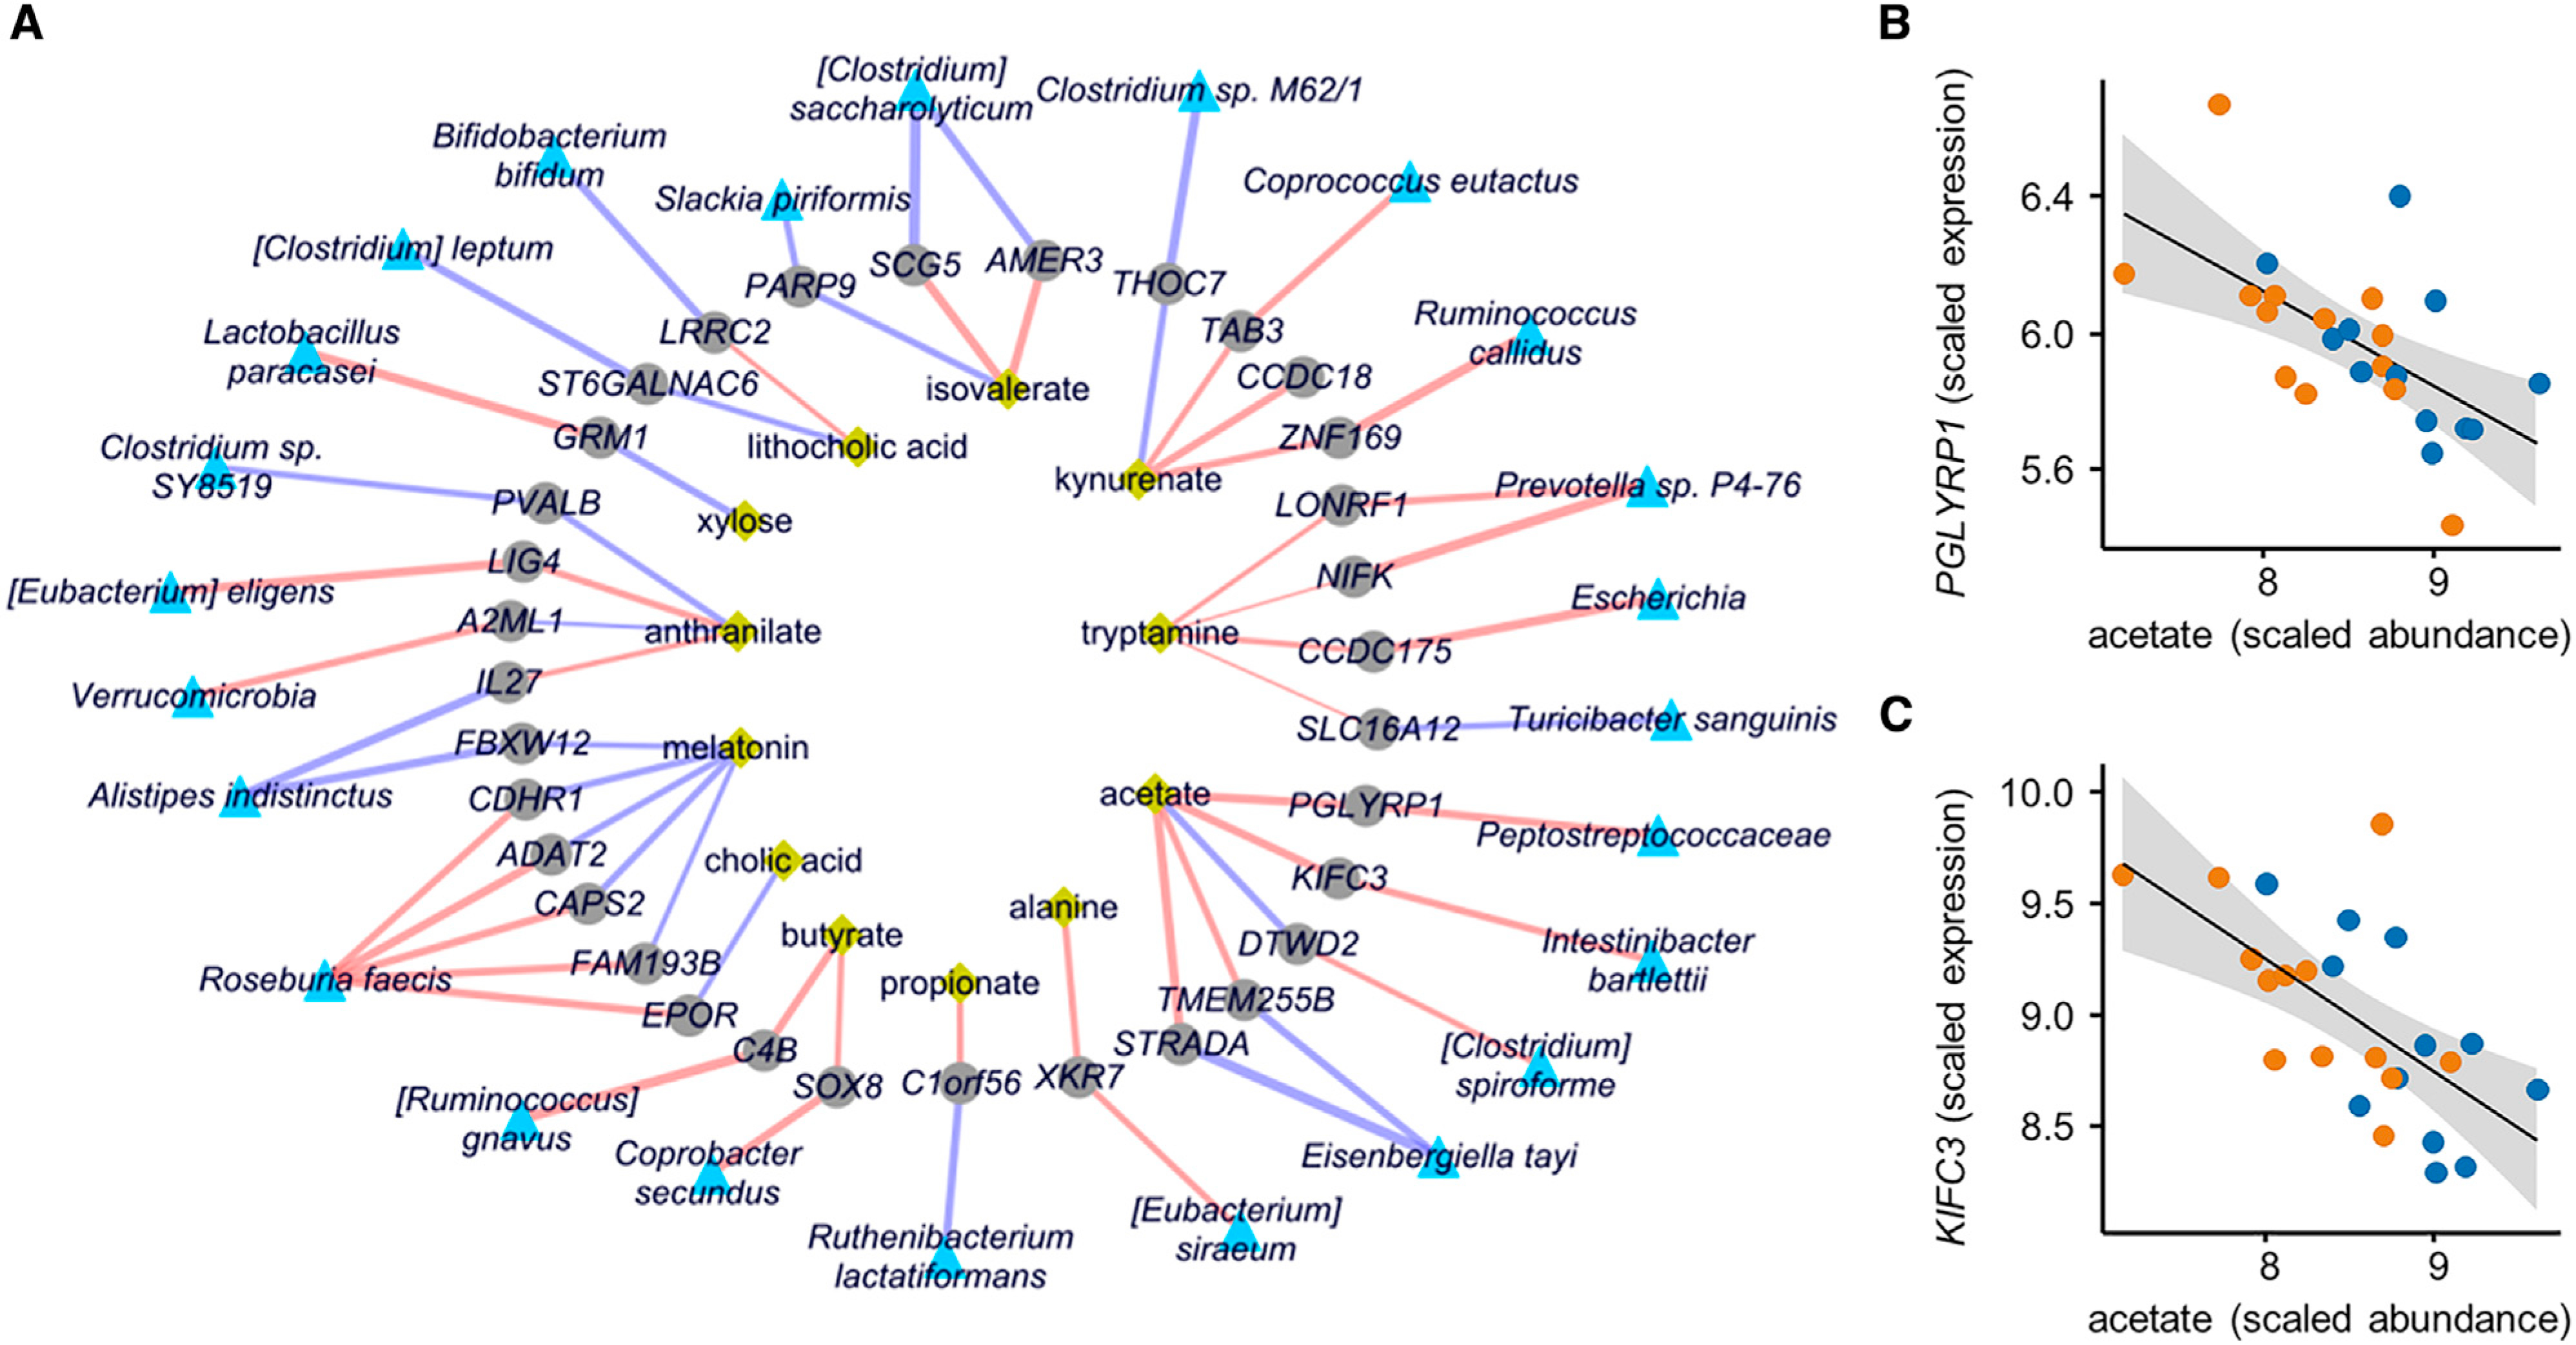
Figure 6. Multi-omics Integration Results from Lasso Penalized Regression.

(A) Network representing significant and stability-selected correlations of host genes (gray nodes) with fecal microbial taxa (blue nodes) and fecal metabolites (yellow nodes) at FDR <0.25. Purple edges indicate positive correlation and red edges indicate negative correlation, and edge width indicates the strength of correlation (Lasso regression using 25 IBS patients and 13 matched HC datasets).
(B) Lasso correlation plots between acetate with PGLYPR1 (FDR <0.001) and acetate (FDR <0.05) from network shown in A). Orange and blue points represent IBS-C and IBS-D subjects, respectively.
(C) Same as (B) for KIFC3.
