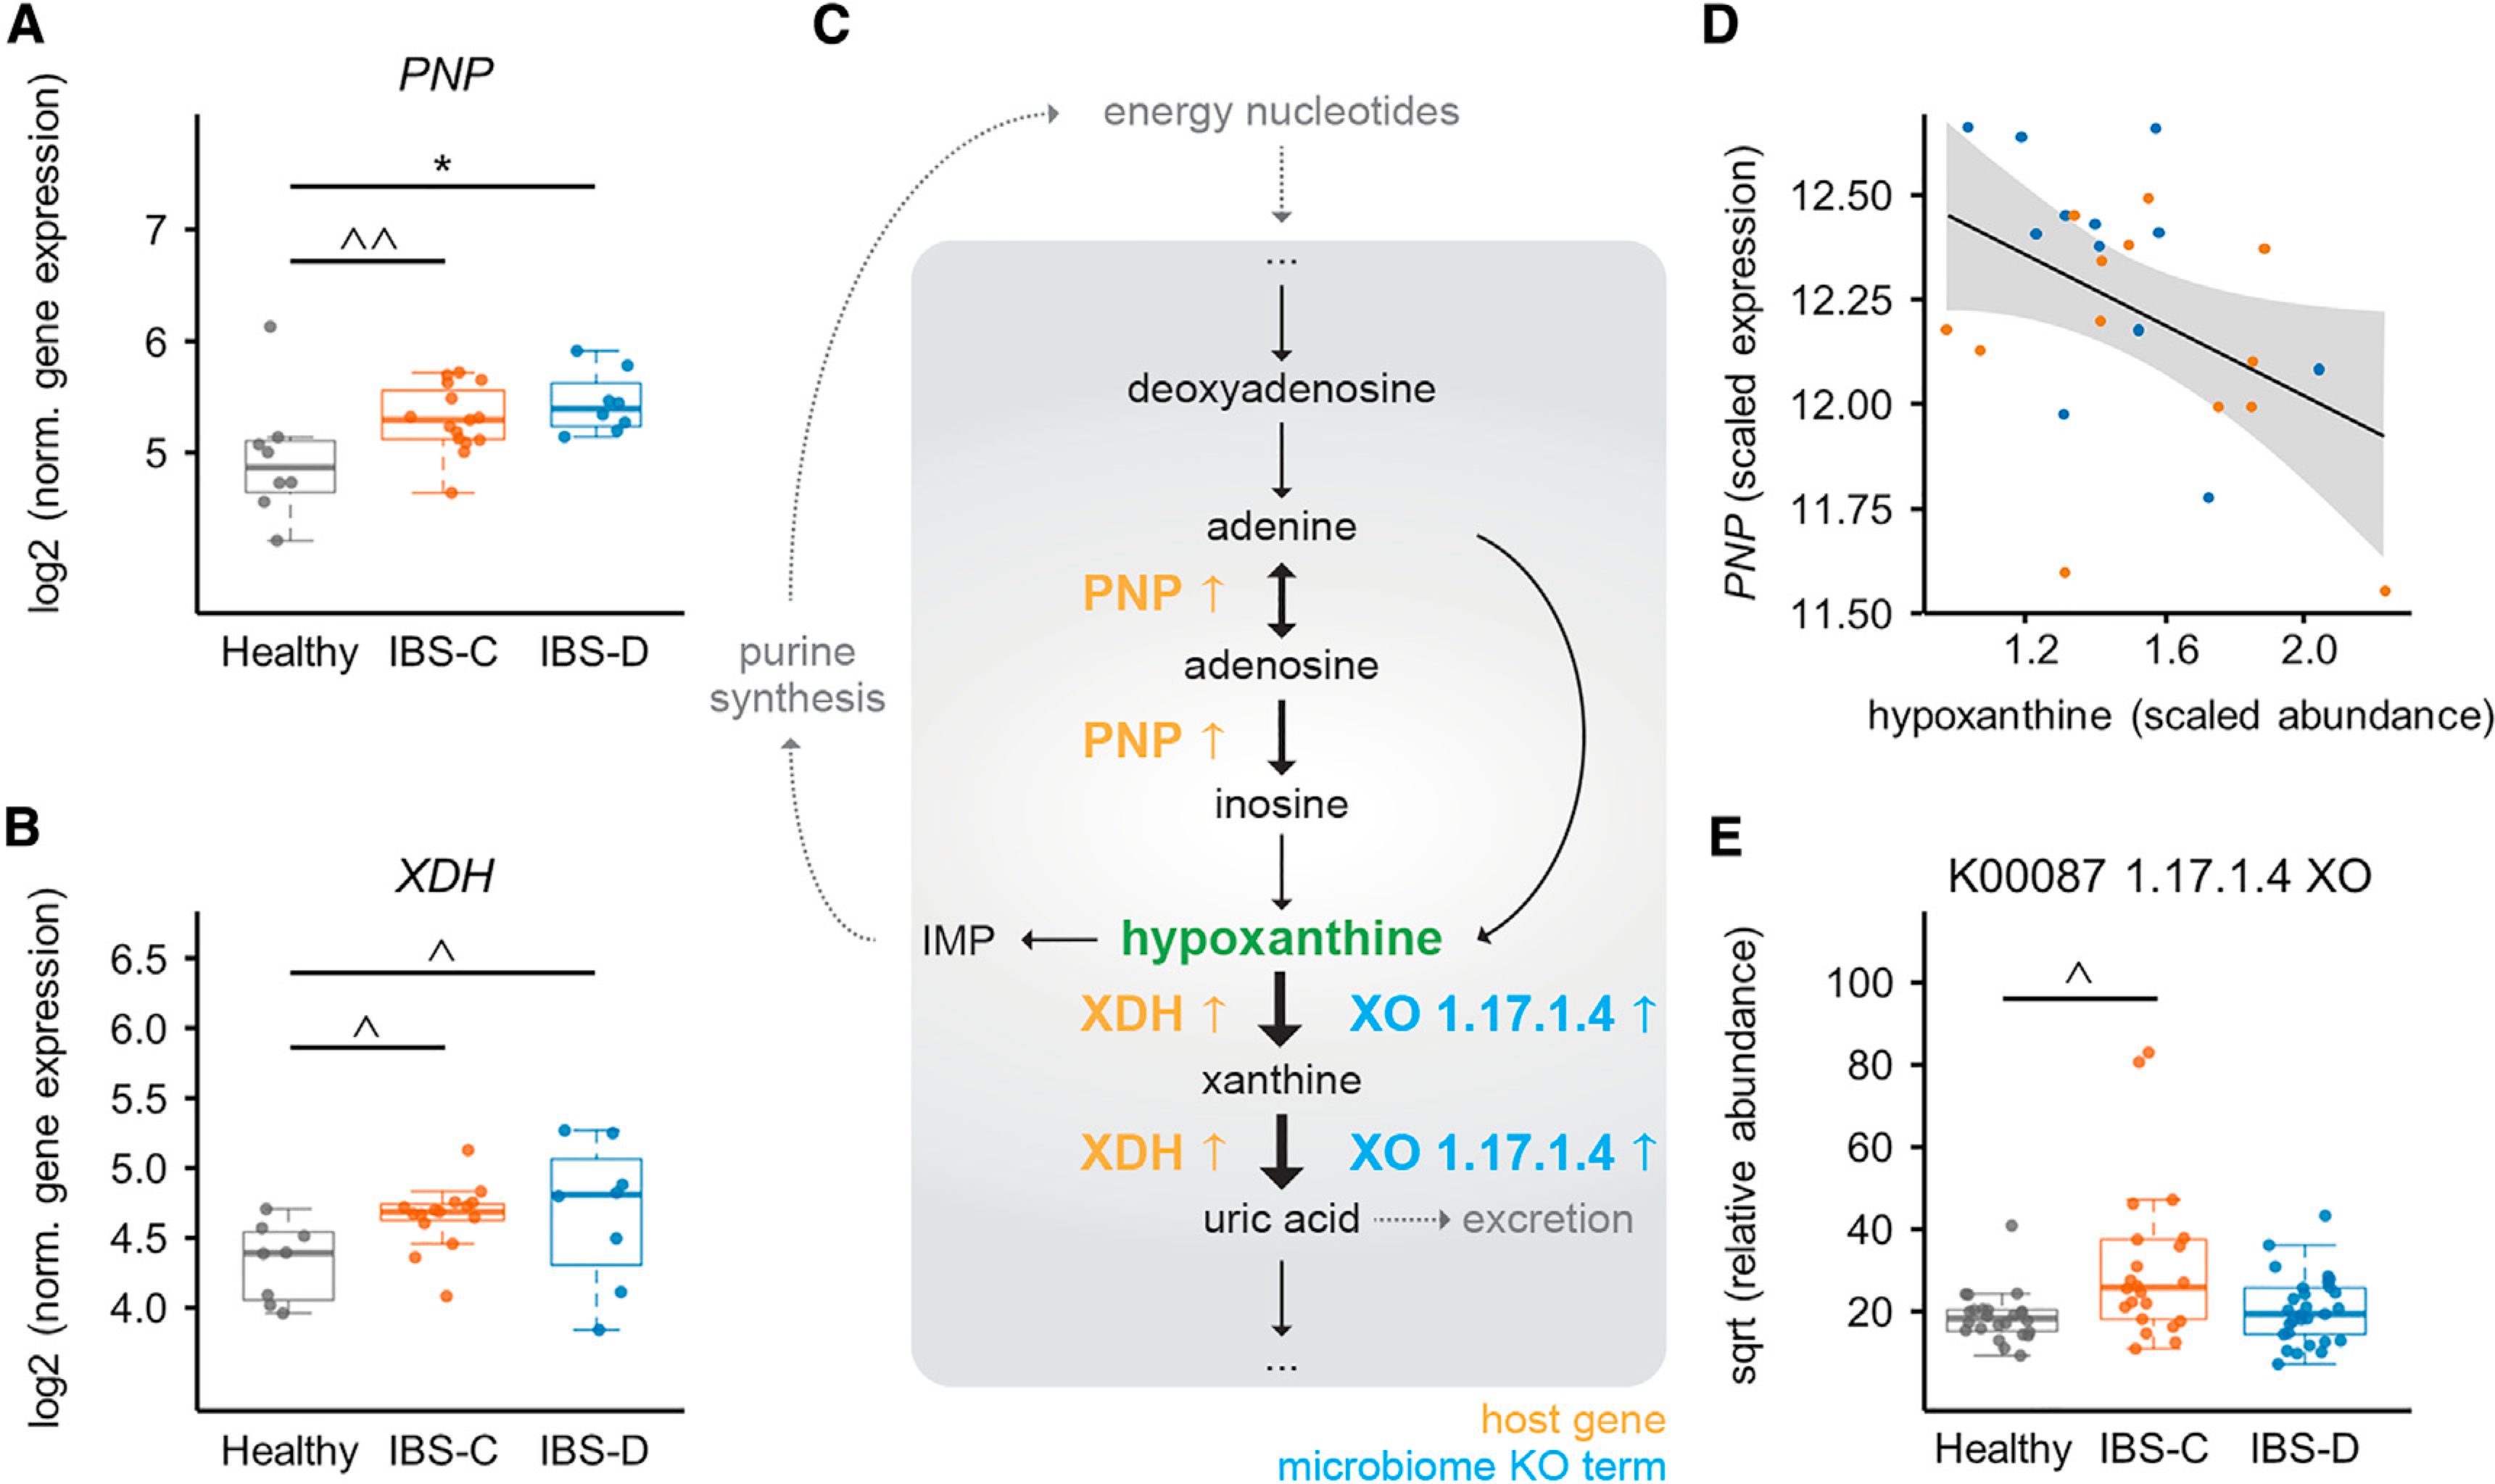
Figure 7. An Integrated Multi-omics View of IBS Points to Microbiome-Host Interactions in the Purine Salvage Pathway.

(A) Purine nucleoside phosphorylase (PNP) expression in colonic biopsy tissue (for A and B, ANOVA Tukey HSD, n = 15, 8, and 8 time-point-averaged female biopsy transcriptomes for IBS-C, IBS-D, and HC, respectively). For full statistical results split by time point, see Table S6 (p = < 0.001 for IBS-C and IBS-D versus HC for biopsies from first time point (IBS-D versus HC FDR 0.018), from generalized binomial test).
(B) Gene expression of human XDH in colonic biopsy tissue. For full statistical results split by time point, see Table S6 (p value 0.022 for IBS-C and 0.101 for IBS-D in time point 1 and <0.005 for time point 2 (with IBS-C versus HC FDR <0.05), from generalized binomial test).
(C) Simplified human-microbiome purine nucleotides degradation pathway with identified IBS-relevant changes indicated. Black arrows indicate metabolic steps, and yellow and blue up arrows indicate elevated expression or abundance in IBS.
(D) Lasso correlation plot between hypoxanthine and PNP (FDR <0.001). Orange and blue points represent IBS-C and IBS-D subjects, respectively.
(E) Metagenomic xanthine oxidase module abundance for all groups (also shown in Figure 3D for IBS-C; IBS-C versus HC FDR <0.1, Mann-Whitney U test. n = 22, 29, and 24 averaged gut microbiome profiles for IBS-C, IBS-D, and HC, respectively).
Boxplot center represents median and box IQR. Whiskers extend to most extreme data point <1.5 × IQR. Symbols indicate significance (*p = < 0.05, ^p = < 0.1, ^p = < 0.2).
