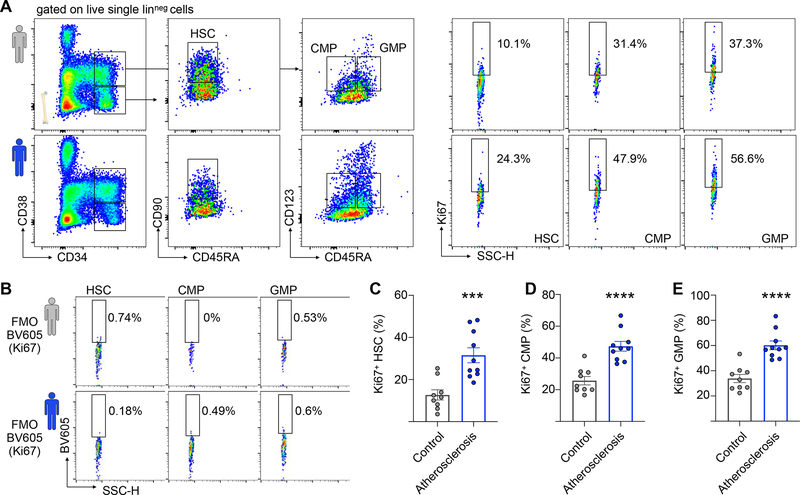
Figure 2. Atherosclerosis associates with increased HSC proliferation in human patients.
(A) Representative flow cytometry plots and gating strategy for human bone marrow HSCs, CMPs and GMPs. The top row (grey human symbol) represents a healthy 72-year-old female (patient #9); the bottom row (blue human symbol) represents a 72-year-old male atherosclerosis patient (patient #18). (B) Fluorescence-minus-one (FMO) controls for patients #9 and #18. (C-E) Quantification of BrdU+ HSC (C) CMP (D) and GMPs (E) in controls (n=9) and patients with atherosclerosis (n=10). Data are represented as mean ± SEM. Unpaired t-tests with Welch’s correction were used for statistical analysis in (C-E). All tests were two-sided. *** indicates p=0.0005, **** indicates p<0.0001. See also Figure S1 and Table S1.

