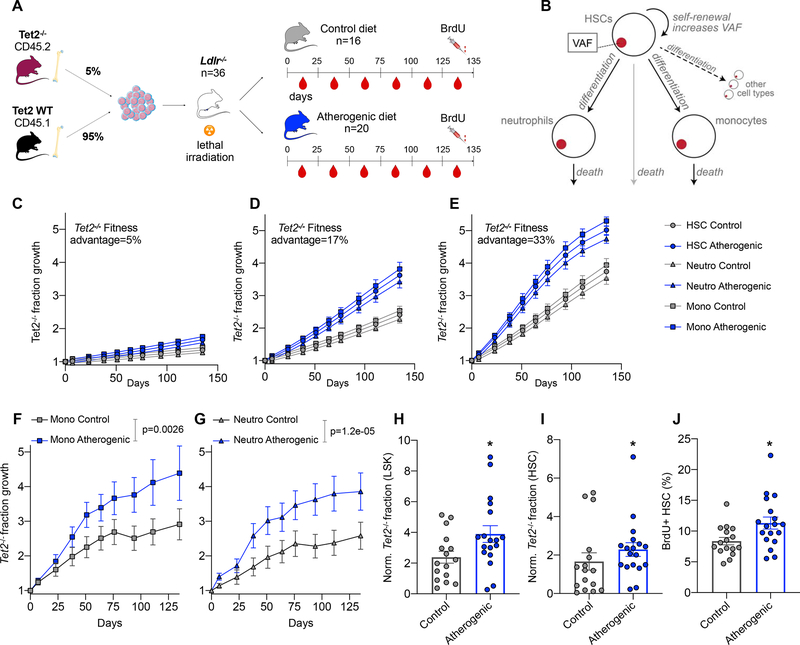
Figure 5. Accelerated Tet2−/− fraction growth in the Ldlr−/− mouse model of atherosclerosis.
(A) Schematic overview of an experiment designed to track the evolution of Tet2−/− cells in atherosclerotic mice. (B) A slightly modified version of the driver clone model (Figure 3) which explicitly incorporates monocytes and neutrophils (STAR methods) is used to predict the expected outcome of the experiment shown in (A). (C-E) Predictions of the model in (B) for s=5% (C), s=17% (D) and s=33% (E). We model a proliferation rate b = 1/(17.5 days) in the control group and a 75% elevation of b associated with the atherosclerosis trait complex. HSCs, neutrophils, monocytes are shown as circles, triangles and squares, respectively. The y-axis denotes fold change of the Tet2−/− fraction with respect to the starting time point. Error bars indicate the SEM. (F-G), Results of the experiment shown in (A). The Tet2−/− (CD45.2) fraction of monocytes (F) and neutrophils (G) is shown across all peripheral blood measurements in Ldlr−/− mice receiving control or atherogenic diets. Error bars indicate the SEM, p-values are derived from linear regression of the logit-transformed baseline-normalized data. Y-axes as in (C-E). (H) Fraction of Tet2−/− LSKs at the end of the experiment shown in (A), day 135. Since engraftment varies stochastically and every mouse has a different fraction of mutant cells at the outset of the experiment, the percentage of Tet2−/− LSKs is normalized to baseline (divided by the CD45.2+ neutrophil percentage at day 0). P-values are calculated with a two-sided Mann-Whitney test. (I) as in (H) for HSCs. (J) Quantification of BrdU+ HSCs on day 135. P-values are calculated with a two-sided Mann-Whitney test. n=16 in the control group and n=18 in the atherosclerosis group in panels H-J (two mice died during the experiment in the atherosclerosis group). * indicates p<0.05. See also Figure S6–S7 and Table S3.

