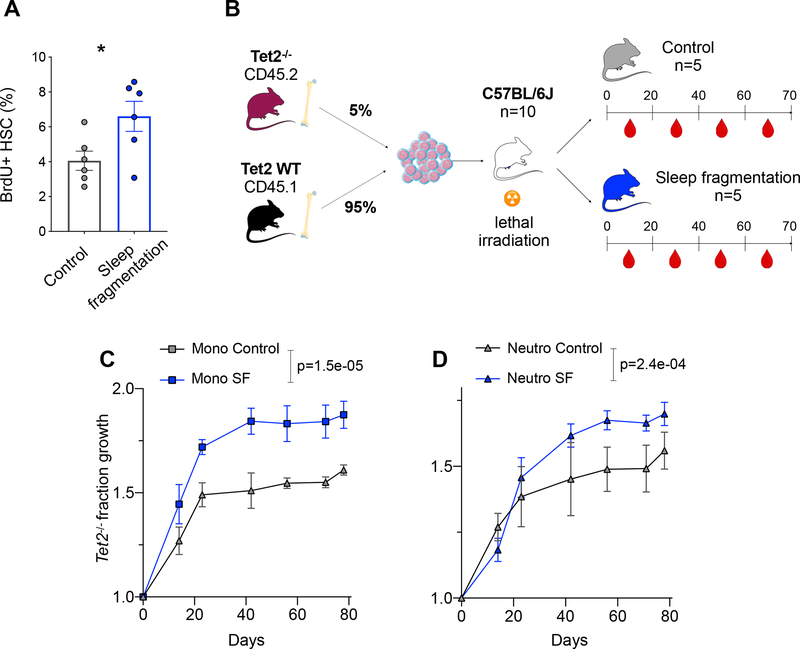
Figure 6. Accelerated Tet2−/− fraction growth in a sleep fragmentation mouse model.
(A) BrdU incorporation (after a 2-hour pulse) in HSCs of C57BL/6J mice exposed to sleep fragmentation (n=6) vs. control mice on a normal sleep schedule (n=6). Two-sided t-test with Welch’s correction. (B) Schematic of an experiment to track the evolution of Tet2−/− cells in sleep-deprived mice, as in Figure 5A. (C-D) Tet2−/− (CD45.2) fraction growth in monocytes (C) and neutrophils (D) is shown across all peripheral blood measurements in control mice or mice exposed to sleep fragmentation (SF). Error bars indicate the SEM; p-values are derived from linear regression of the logit-transformed baseline-normalized data. Axes as in Figure 5F–G. * indicates p<0.05. See also Figure S7.

