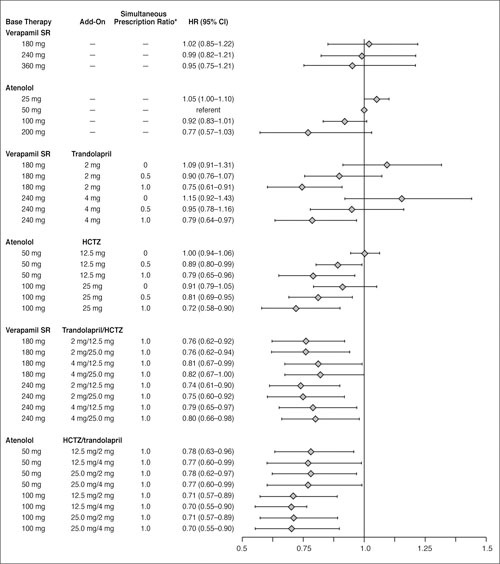
Figure 4.

Estimated hazard ratios (HR) and 95% confidence intervals (CI) from Cox proportional hazards model of time to primary outcome for select average daily dose combinations of strategy drugs, relative to atenolol 50 mg/d in the atenolol‐based treatment strategy. SR=sustained release; HCTZ=hydrochlorothiazide; *ratio with a value ranging from 0 to 1 that represents the amount of time specific verapamil SR/trandolapril or atenolol/HCTZ dose combinations were prescribed simultaneously
