
Figure.
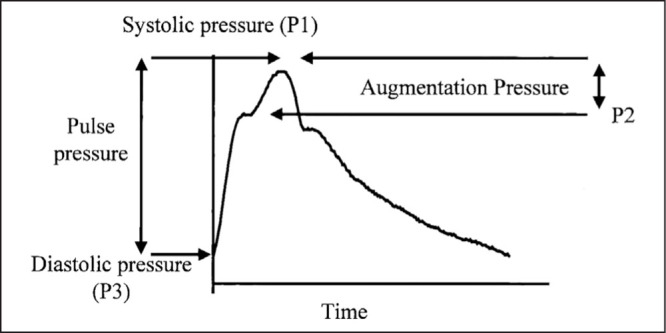
A representative central arterial waveform with pulse pressure and augmentation pressure indicated. In this study, augmentation index (dimensionless) was reported as 100×(P1–P3)/(P2–P3). P2 indicates the first systolic peak and P1 the second (in this case P1 is the systolic pressure).
Adapted with permission from Dart AM, Reid CM, McGrath B, et al. Effects of ACE inhibitor therapy on derived central arterial waveforms in hypertension. Am J Hypertens. 2001;14(8 pt 1):804–810.