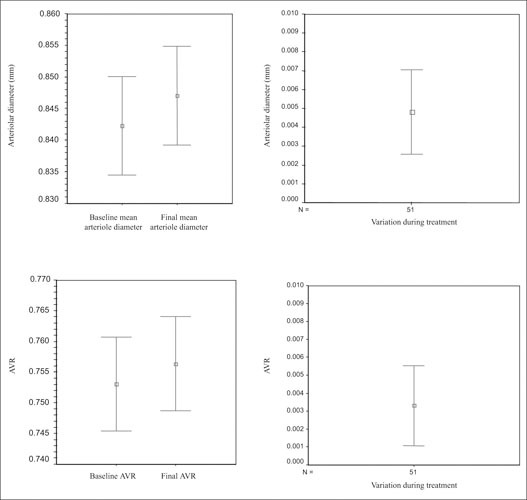
Figure.

Mean diameters of retinal arterioles, and the arteriovenous ratio (AVR), before and after 6 months of antihypertensive treatment (left). Bars indicate 95% confidence intervals [CIs]. The differences in arteriole diameter and AVR (right) are statistically significant (p<0.001 and p=0.005, respectively). The correlation between baseline and final AVR is 0.957 (p=0.000). The 95% CIs of the variations of arteriole diameter and AVR ratio include no 0.000, confirming the difference between groups.
