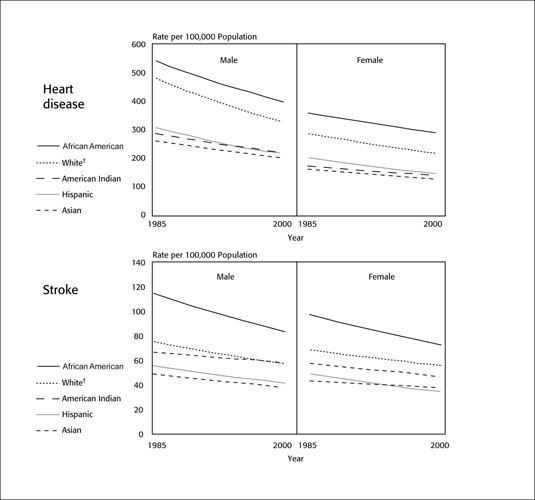
Figure 5.

Age‐adjusted death rates for heart disease and stroke by gender, race, and ethnicity, United States 1985–2000. Each line is a log‐linear regression derived from the actual rates; †non‐Hispanic Adapted with permission from Disease statistics. In: NHLBI Fiscal Year 2002 Fact Book. Bethesda, MD: National Institutes of Health, National Heart, Lung, and Blood Institute; 2003:35–54.
