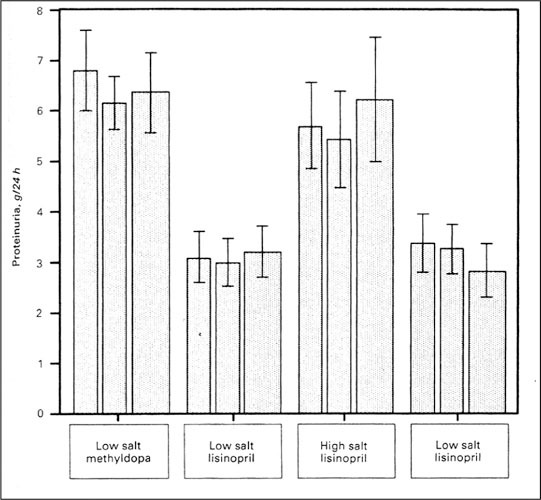
Figure 3.

Urine protein excretion in nine patients with nephropathy depending on salt intake and antihypertensive therapy. The bars represent mean±SEM of 24‐hour urine protein in the last month of the study periods. Wide bars represent the mean of three samples before visits, whereas the narrow bars indicate values from preceding visits. Reprinted with permission from Kidney Int. 1989;36:272–279. 11
