
Figure 7.
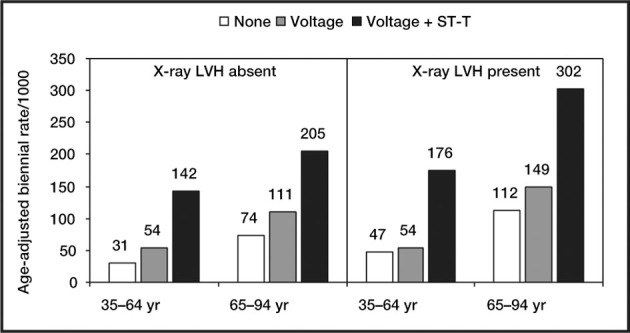
Risk of cardiovascular disease by x‐ray and electrocardiographs left ventricular hypertrophy in a 34‐year Framingham Study follow‐up in men. The presence of ST‐T changes (i.e., “strain” pattern) on an electrocardiogram conveys additional risk beyond excess voltage. LVH=left ventricular hypertrophy. Data derived from J Hypertens. 1991;9(suppl 2):S3‐S9. 2