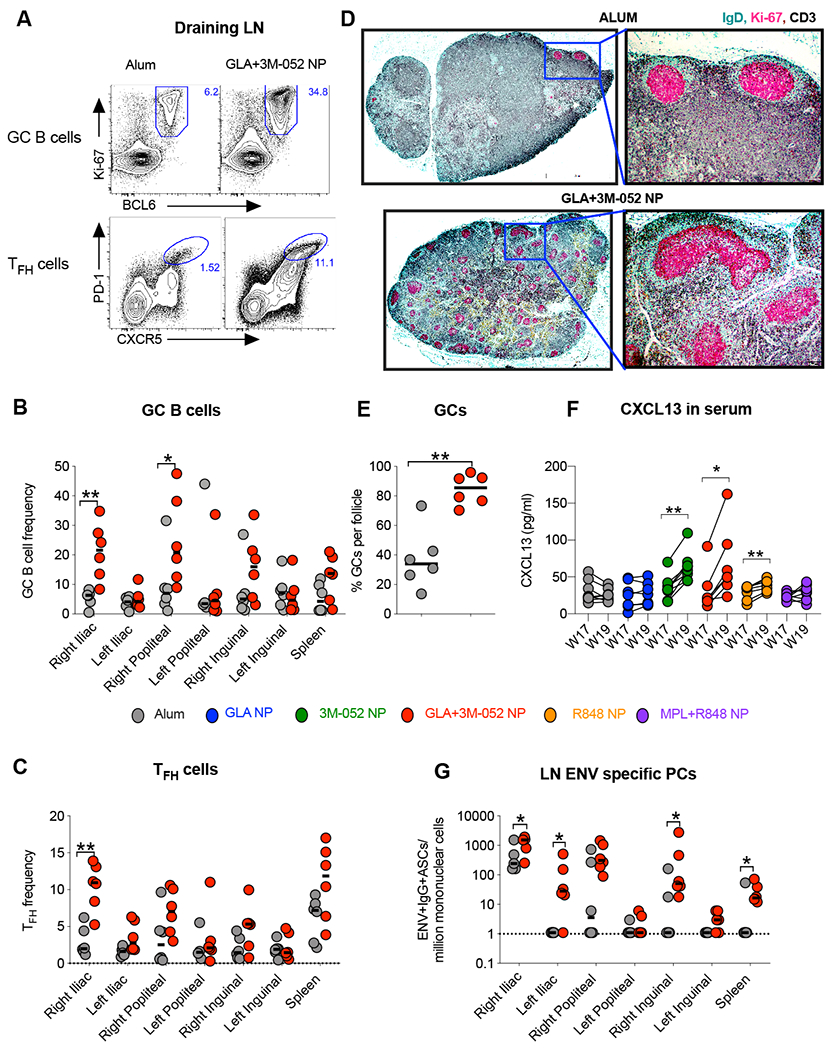
Fig. 6. 3M-052 adjuvant formulated in PLGA NP’s with GLA induces significantly higher GC B cells, TFH and Env specific PC responses in RM draining lymph nodes (dLNs) in comparison with those induced by alum adjuvant.

Data shown in the figure summarizes immune responses at ~week 22 or 4 weeks post final vaccination in n = 6 animals in the mechanistic arm, assigned to treatment groups 1 and 4 in the study (see study design in Figure 1). (A) Representative flow cytometry plots are shown highlighting GC B cells (live,CD3-CD20+Ki67+Bcl6+) and GC TFH cells (live,CD3+CD4+ PD-1 high and CXCR5 high). Bar graphs summarize (B) frequencies of GC B cells and (C) frequencies of GC TFH cells. (D) Immunohistochemistry was performed on draining Iliac LNs in n=6 animals from the alum and GLA+3M-052 NP adjuvant treated animals respectively. Green, magenta and black colors were used to represent staining for IgD, Ki67 and CD3 staining respectively. Figure represents low magnification and high magnification images from alum and GLA+3M-052 NP adjuvanted animals (see methods for details). (E) Graph summarizes percent of B cell follicles staining positive for GCs with immunohistochemistry (F) Graph shows relative increase in CXCL13 chemokine in RM plasma one week before and after the final vaccination. (G) Graph summarizes Env specific plasma cells ( B cell ELISPOT assay) per million live mononuclear cells in various draining and non-draining LNs. Statistical significance of differences in magnitude of immune responses was tested with a two tailed non-parametric Mann-Whitney test using the Graph Pad Prism version 8.0 software. ****p<0.0001: ***p<0.001: ** p<0.01,*p<0.05.
