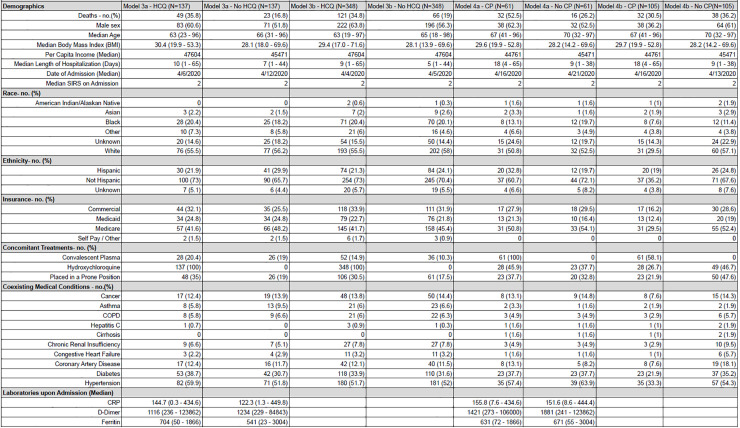
Fig 4. Demographic data for propensitiy score matching of hydroxychloroquine (HCQ) and convalescent plasma (CP) groups.
(A) Propensity score matching was used to create a number of cohorts, and demographics for each cohort are shown in the table above. Model 3a and 3b separate groups with respect to hydroxychloroquine, and model 4a and 4b with respect to convalescent plasma. Percentages of each group are expressed in parenthesis for categorical variables and ranges for continuous. Race and ethnicity are self-reported. Models 3a and 4a included lab values for matching.

