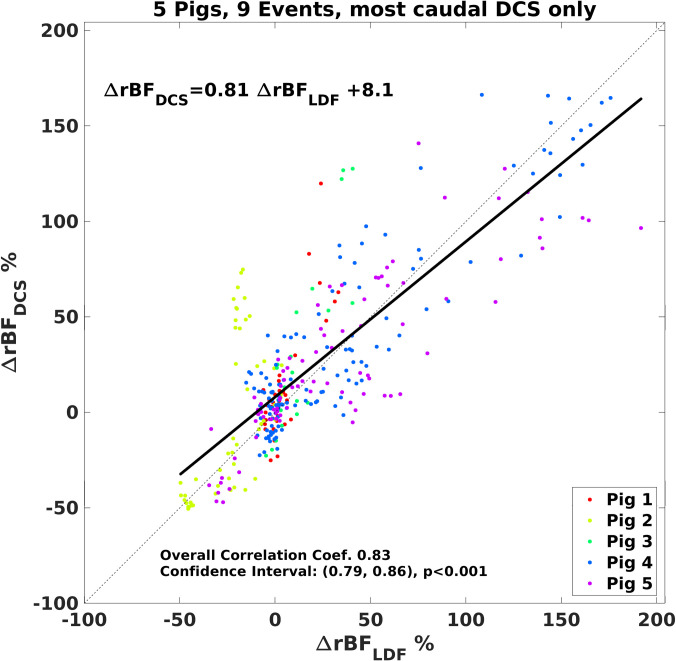
Fig 5. Comparison of changes in relative cerebral blood flow measured by the LDF and most caudal DCS sensors.
A best linear fit line is shown (black) along with a 1:1 line (dashed black line). The overall correlation coefficient was 0.83 (p<0.001; 95% confidence interval, (0.79, 0.86)). Measurements made in 5 pigs during hypoxia-hypercarbia (pCO2 range 20.7 to 93.7 mmHg).

