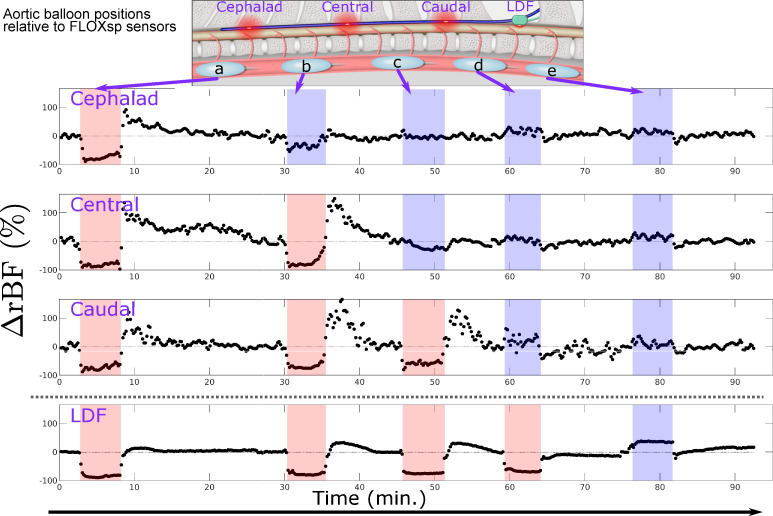
Fig 6. Time course of blood flow changes during serial aortic balloon inflation and occlusion.
The balloon was moved from cephalad to caudal locations (schematic, inset), measuring at three different sites with DCS (cephalad, central, and caudal) and one site with LDF. Shaded regions indicate that the aortic balloon was inflated. Red (blue) shading indicates the balloon was cephalad (caudal) to the measurement site. As discussed in the text, a cutoff of ΔrBF = -30% permitted localization of the balloon inflation relative to the DCS measurement sites, i.e., ’above all’ (a), ’between cephalad and central’ (b), ’between central and caudal’ (c), and ’below all’ (d, e). In situations where the sensor position was only slightly cephalad to the balloon, we occasionally observed slight decreases (e.g., cephalad sensor near minute 30) and increases (e.g., caudal DCS near minute 60). This effect may be due to the precise local vascular anatomy and degraded the accuracy of localization. Anecdotally, we observed smaller increases in blood flow following balloon deflation with LDF, although this reactivity was not the focus of our study.

