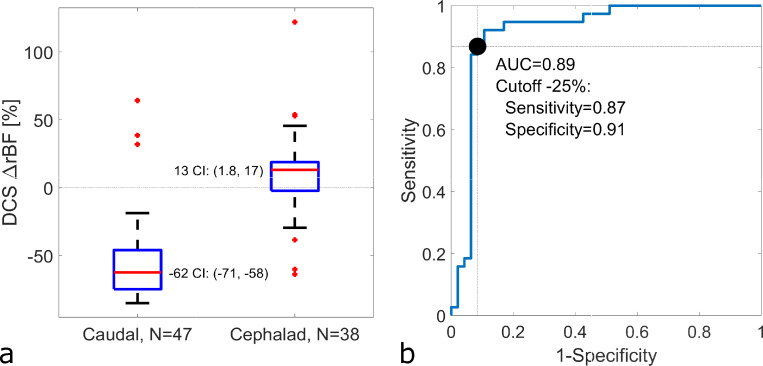
Fig 7. Blood flow changes in spinal cord regions cephalad and caudal to aortic occlusion at multiple positions and repetitions.
No correction for multiple measurements in the same pig (N = 5). (a) Blood flow below the site of aortic balloon inflation fell -62% (95% confidence interval, CI: -71, -58%) from baseline, while blood flow above the aortic occlusion increased 13% (1.8, 17%) from baseline, rejecting the null hypothesis at a significance of 0.05 that the blood flow below the balloon site did not change (i.e., ΔrBF = 0). The respective interquartile ranges for the caudal and cephalad measurements were [–75–46] % and [–2 18] % respectively. (b) Receiver operating characteristic curve of the ability of DCS flow to predict the placement of the aortic balloon cephalad to the DCS sensors, including sensitivity (0.87) and specificity (0.91) calculated for a cutoff of ΔrBF = -25% to detect an aortic occlusion cephalad to the sensor location (S1 Table).

