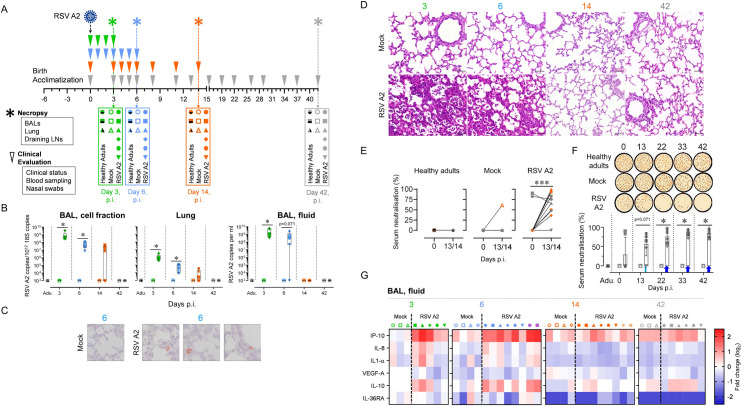
Fig 1. RSV A2 infection is causing lower respiratory tract disease and leading to a potentially protective humoral response.
(A) Illustration of the trans-tracheal RSV A2 infection experimental design. RSV A2-infected animals were injected with 108 PFU of RSV A2. As controls, PBS-injected newborns and non-infected adults were used. Before and after RSV A2 infection, clinical evaluation was assessed daily at early time points (between day 0 and day 6) and twice a week at later time points (between day 7 and day 42). Necropsies were done at days 3, 6, and 14 or 42 p.i. (B) RSV A2 was quantified in the respiratory tract (BAL, cell fraction; Lung; BAL, fluid) by qPCR. (C) RSV A2-positive cells detection by immunohistochemistry in lung tissue section from RSV A2-infected neonate (Mock = mock neonate). (D) Representative histological lung tissue sections from neonates over the course of RSV A2 infection (40X, HE). Lungs of RSV A2-infected animals show interstitial septae expanded by inflammatory cells (interstitial pneumonia) and accumulation of inflammatory cells within alveoli at days 3 and 6 p.i. No lesions at days 14 and 42 p.i. The lungs of mock neonates allow comparison with normal lung architecture within the first weeks of life. (E) Neonates infected with RSV A2 can mount an antiviral neutralizing-antibody response. Serums collected in animals prior RSV A2 infection (0), and at days 13 or 14 p.i. (13/14), were co-incubated with RSV A2 (100 PFU) and applied to HEp-2 cells for 48 hours. (F) Anti-RSV A2 Nabs persist over a 42-day long period. Serums collected in animals prior RSV A2 infection (0), and at days 13, 22, 33, 42 p.i. were co-incubated with RSV A2 (100 PFU) and applied to HEp-2 cells for 48 hours. (G) Multiplex immunoassay using BAL from all neonates included in the study. Cytokine concentrations were quantified with a multiplex assay and a single measurement was done per animal tested. Heat map showing log2-fold changes in concentration of 6 measured cytokines/chemokines normalized by mean value of control group: Mock, 3 days p.i. (A-G) Each symbol represents an individual animal (healthy adults, n = 12; mock neonates, n = 3 per time point; neonates infected with RSV, n = 6 per time point). Boxplots indicate median value (center line) and interquartile ranges (box edges), with whiskers extending to the lowest and the highest values. Adu., healthy adults. Groups were compared using Mann–Whitney U tests (B, F) and Wilcoxon tests (E). Stars indicate significance levels. *, p < 0.05; ***, p < 0.001.

