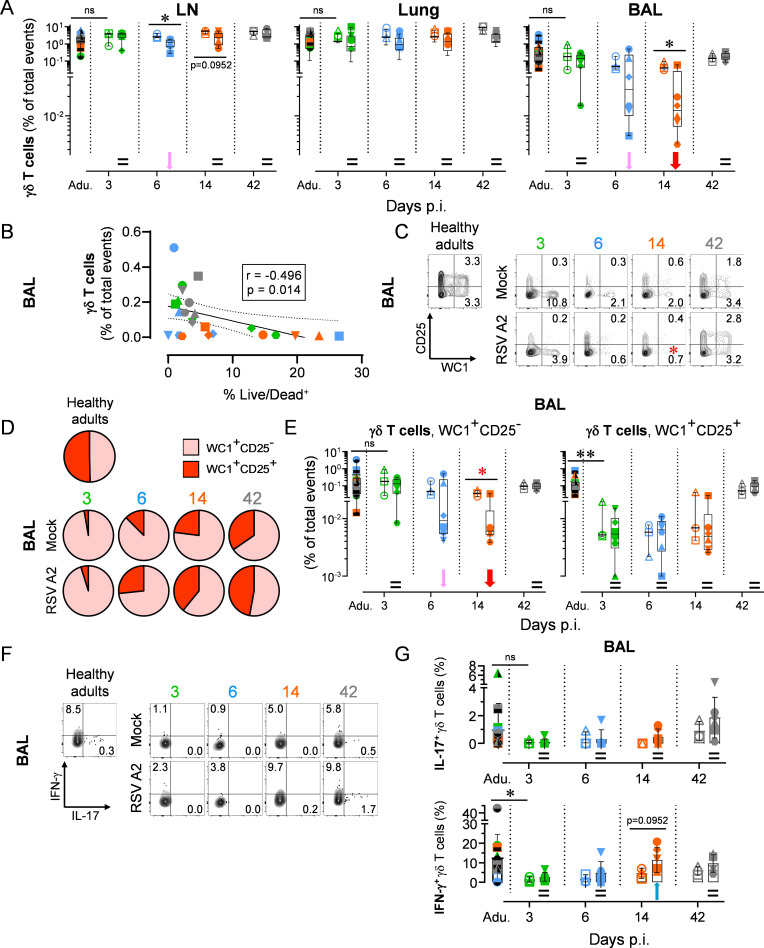
Fig 3. Neonatal RSV A2 infection activates a transient depletion of γδ T cells and deficiency of IL-17-mediated immunity.
(A) Neonatal RSV A2 infection induces a decrease in γδ T cells number in the bronchoalveolar space, but not in the lung tissue. (B) Correlation coefficient (r) obtained with in γδ T cell counts calculated as a function of % Live/Dead+. (C-E) Replenishment and maturation (CD25 up-regulation) of γδ T cell subset following the depletion after RSV A2 infection. WC1 is highly expressed in ruminant γδ T cells and is commonly used as a specific marker of this subset [68]. (C) Representative FACS contour plots. Numbers indicate the mean percentage of animals per group per time point. Red asterisk indicate significant differences between RSV A2 and Mock groups for a given time point. (D) As in (C) but with pie charts displaying all individuals. (E) Neonatal RSV A2 infection induces a decrease in γδ T cells number in the bronchoalveolar space. (F-G) Inability of γδ T cells to produce IL-17. (F) Representative FCM contour plots. Numbers indicate the mean percentage of animals per group per time point. (G) As in (F) but with plots displaying all individuals. (A-G) Each symbol represents an individual animal (healthy adults, n = 12; mock neonates, n = 3 per time point; neonates infected with RSV, n = 6 per time point). Boxplots indicate median value (center line) and interquartile ranges (box edges), with whiskers extending to the lowest and the highest values. Adu., healthy adults. Groups were compared using Mann–Whitney U tests (A, C, E-G). Stars indicate significance levels. *, p < 0.05; **, p < 0.01.

