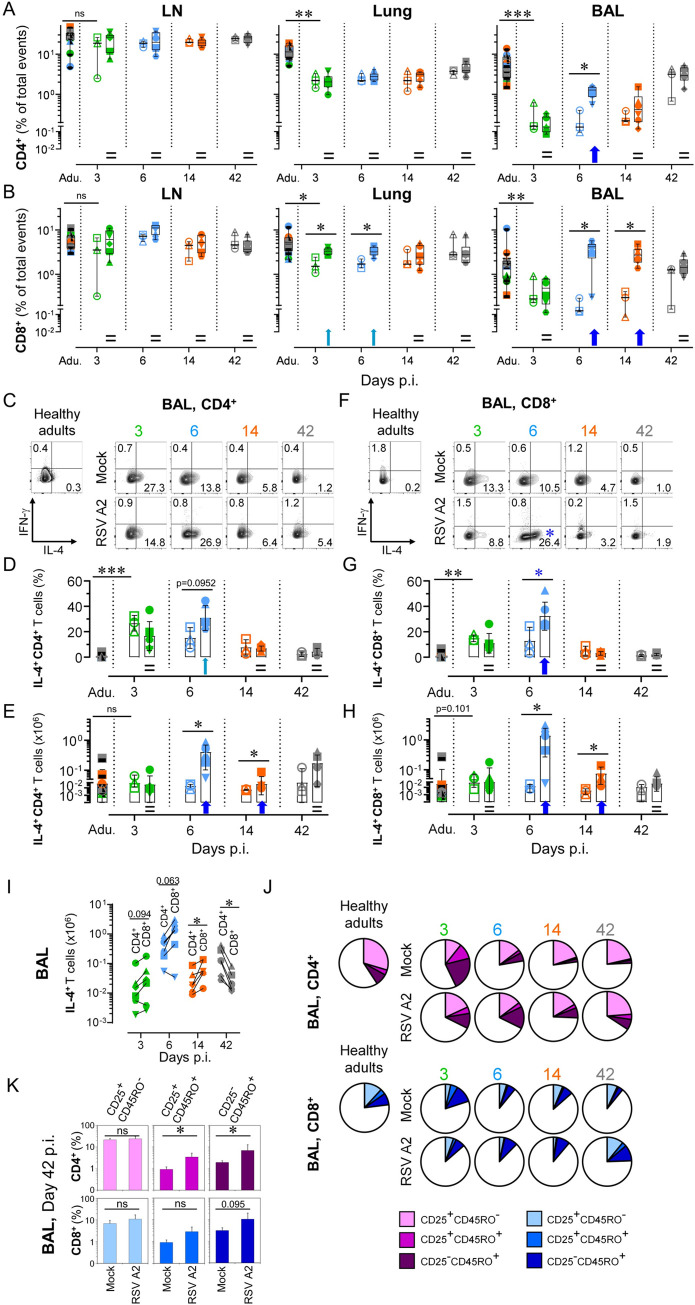
Fig 4. Neonatal RSV A2 infection induces a fast and massive Tc2 influx in the bronchoalveolar space.
(A) RSV A2 infection in neonate accelerates the recruitment of CD4+ in the bronchoalveolar space, but not in peribronchial LNs or lung tissue. (B) RSV A2 infection in neonate induces a strong recruitment of CD8+ T cells in the bronchoalveolar space, and to a lesser extent in lung. (C-E) A high frequency of recruited CD4+ T cells in bronchoalveolar space differentiate towards a Th2 cytokine profile (IL-4 production). (C) Representative FCM contour plots. Numbers indicate the mean percentage of animals per group per time point. (D) As in (C), but with plot displaying all individuals. (E) Absolute count of recruited IL4+ CD4+ T cells in bronchoalveolar space upon RSV A2 infection (F-H) A high frequency of recruited CD8+ T cells in bronchoalveolar space differentiate towards a Tc2 cytokine profile (IL-4 production) (F) Representative FCM contour plots. Numbers indicate the mean percentage of animals per group per time point. Blue asterisk indicate significant difference between RSV A2 and Mock groups for a given time point. (G) As in (F), but with plot displaying all individuals. (H) Absolute count of recruited IL4+ CD8+ T cells in bronchoalveolar space upon RSV A2 infection. (I) Comparison of the absolute numbers of recruited Th2 (IL4+ CD4+) and Tc2 (IL4+ CD8+) cells in bronchoalveolar space upon RSV A2 infection. (J) RSV A2 infection in neonates modulates the activation (cell surface expression of CD25) and the maturation (cell surface expression of T cell memory marker CD45RO) of CD4+ and CD8+ T cell pools in the lung. (K) As in (J), but with histograms integrating all individuals. (A-K) Each symbol represents an individual animal (healthy adults, n = 12; mock neonates, n = 3 per time point; neonates infected with RSV, n = 6 per time point). Boxplots indicate median value (center line) and interquartile ranges (box edges), with whiskers extending to the lowest and the highest values. Adu., healthy adults. Groups were compared using Mann–Whitney U (A-H, K) and Wilcoxon tests (I). Stars indicate significance levels. *, p < 0.05; **, p < 0.01; ***, p < 0.001.

