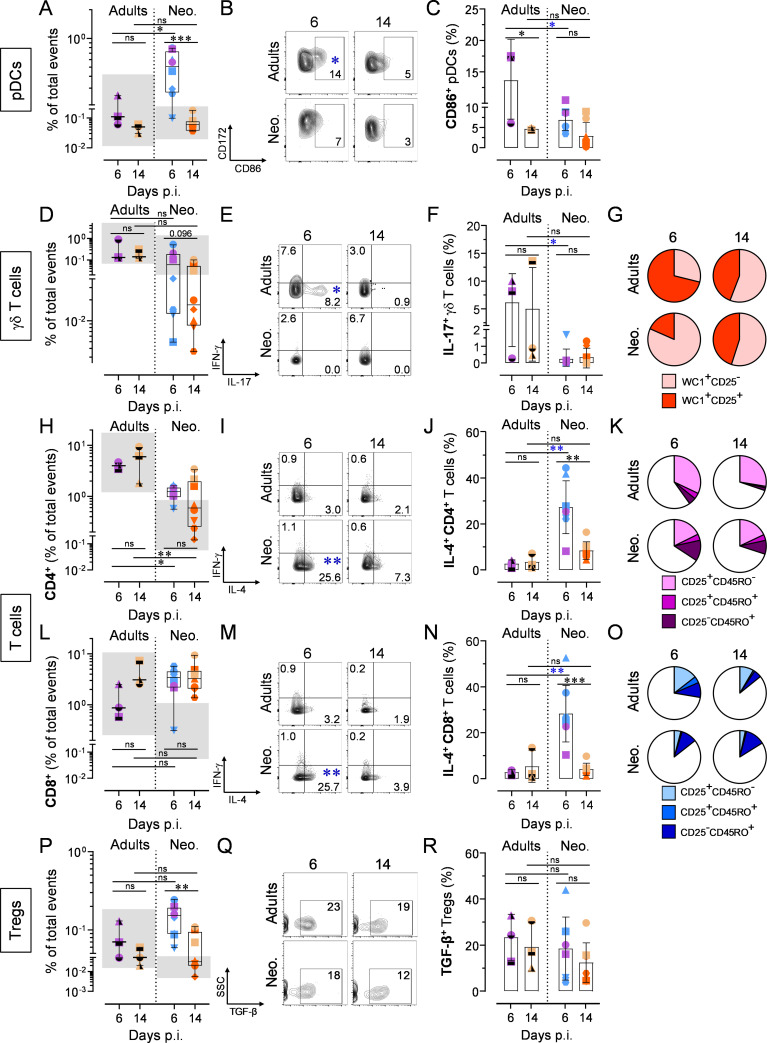
Fig 7. Distinct cellular immune response in neonates compare to adults following RSV A2 infection.
(A-C) Counts of recruited pDCs and CD86 upregulation in bronchoalveolar space. (A) Counts of recruited pDCs in bronchoalveolar space upon RSV A2 infection. (B) Representative FCM contour plots showing CD86 upregulation. Numbers indicate the mean percentage of animals per group per time point. (C) As in (B), but interleaved scatters integrating all animals. (D-G) γδ T cell counts, cytokine production, and maturation in the bronchoalveolar space. (D) Counts of γδ T cells in bronchoalveolar space upon RSV A2 infection. (E) Representative FCM contour plots showing IL-17 secretion. Numbers indicate the mean percentage of animals per group per time point. Blue asterisk indicate significant difference between RSV A2-infected adult and neonate groups for a given time point. (F) As in (E), but interleaved scatters integrating all animals. (G) Pie charts integrating all animals. (H-K) Recruitment, activation, and maturation of the CD4+ T cell pool in the bronchoalveolar space. (H) Counts of CD4+ T cells in bronchoalveolar space upon RSV A2 infection. (I) Representative FCM contour plots showing IL-4 secretion. Numbers indicate the mean percentage of animals per group per time point. Blue asterisk indicate significant difference between RSV A2-infected adult and neonate groups for a given time point. (J) As in (I), but interleaved scatters integrating all animals. (K) Pie charts integrating all animals. (L-O) As in (H-K), but showing CD8+ T cell pool. (P-R) Recruitment of Tregs and TGF-β production in the bronchoalveolar space. (P) Counts of recruited Tregs in bronchoalveolar space. (Q) Representative FCM contour plots showing TGF-β secretion. Numbers indicate the mean percentage of animals per group per time point. (R) As in (Q), but interleaved scatters integrating all animals. (A-R) Each symbol represents an individual animal (infected adults, n = 3 per time point; neonates infected with RSV, n = 8 per time point). The grey zone corresponds to the interval integrating the values of all corresponding mock controls. Boxplots indicate median value (center line) and interquartile ranges (box edges), with whiskers extending to the lowest and the highest values. Groups were compared using one-way ANOVA followed by Turkey’s post hoc test (A, C, D, F, H, J, L, N, P, R). Stars indicate significance levels. *, p < 0.05; **, p < 0.01; ***, p < 0.001.

