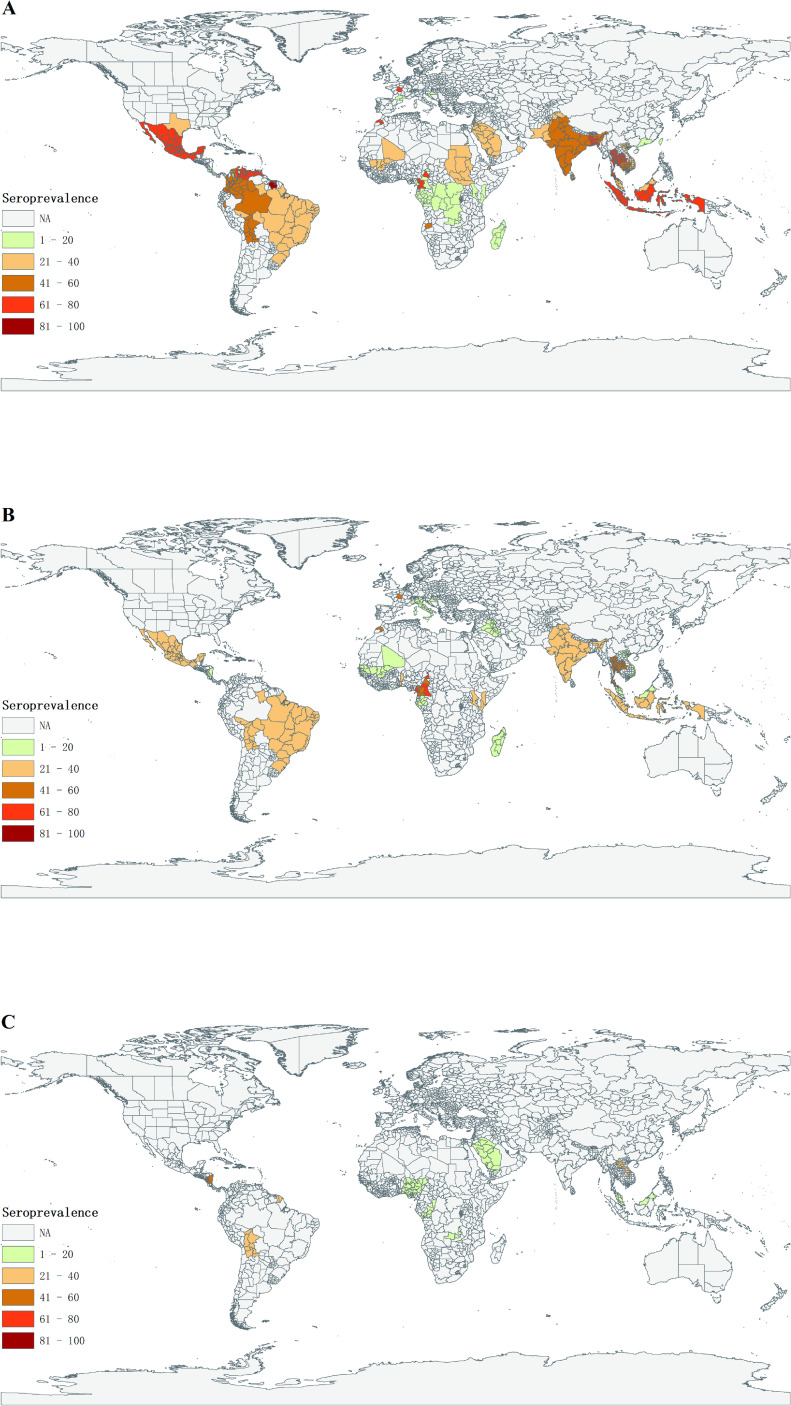
Fig 2. Graphical presentation of seroprevalence across the world for DENV(A), CHIKV(B) and ZIKV (C) infection.
The map was drawn by ArcGIS program (version 10.4.1; ESRI, Redlands, California, USA) using the base layer (https://pro.arcgis.com/zh-cn/pro-app/latest/help/mapping/properties/plate-carree.htm).

