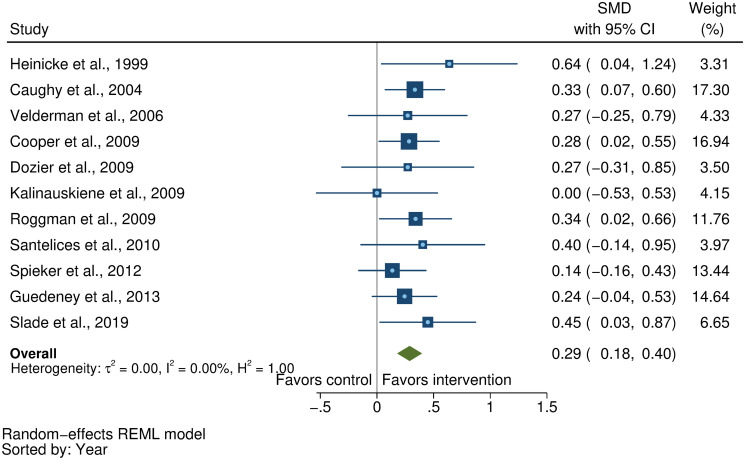
Fig 7. Forest plot for the effect of parenting interventions on attachment.
Blue squares represent the SMD for each study, with the size of the square being proportional to the study weight. The whiskers extending from each side of the square represent the range of the 95% CI. The green diamond shows the overall pooled effect size using a random-effects model, which is centered at the point estimate and the diamond width representing the 95% CI. SMD, standardized mean difference.

