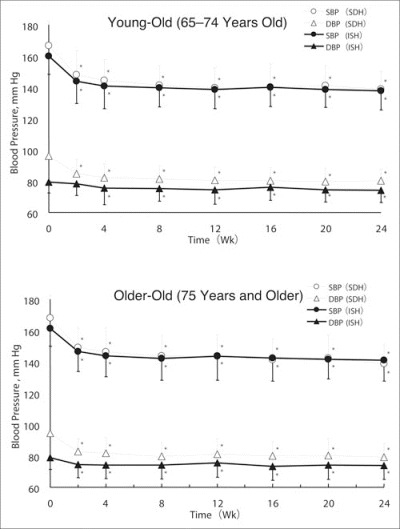
Figure 1.

The time course of changes in blood pressure over the 24‐week course of treatment for the 4 study groups. DBP indicates diastolic blood pressure; ISH, isolated systolic hypertension; SBP, systolic blood pressure; SDH, systolic‐diastolic hypertension. *P<.0001 vs baseline.
