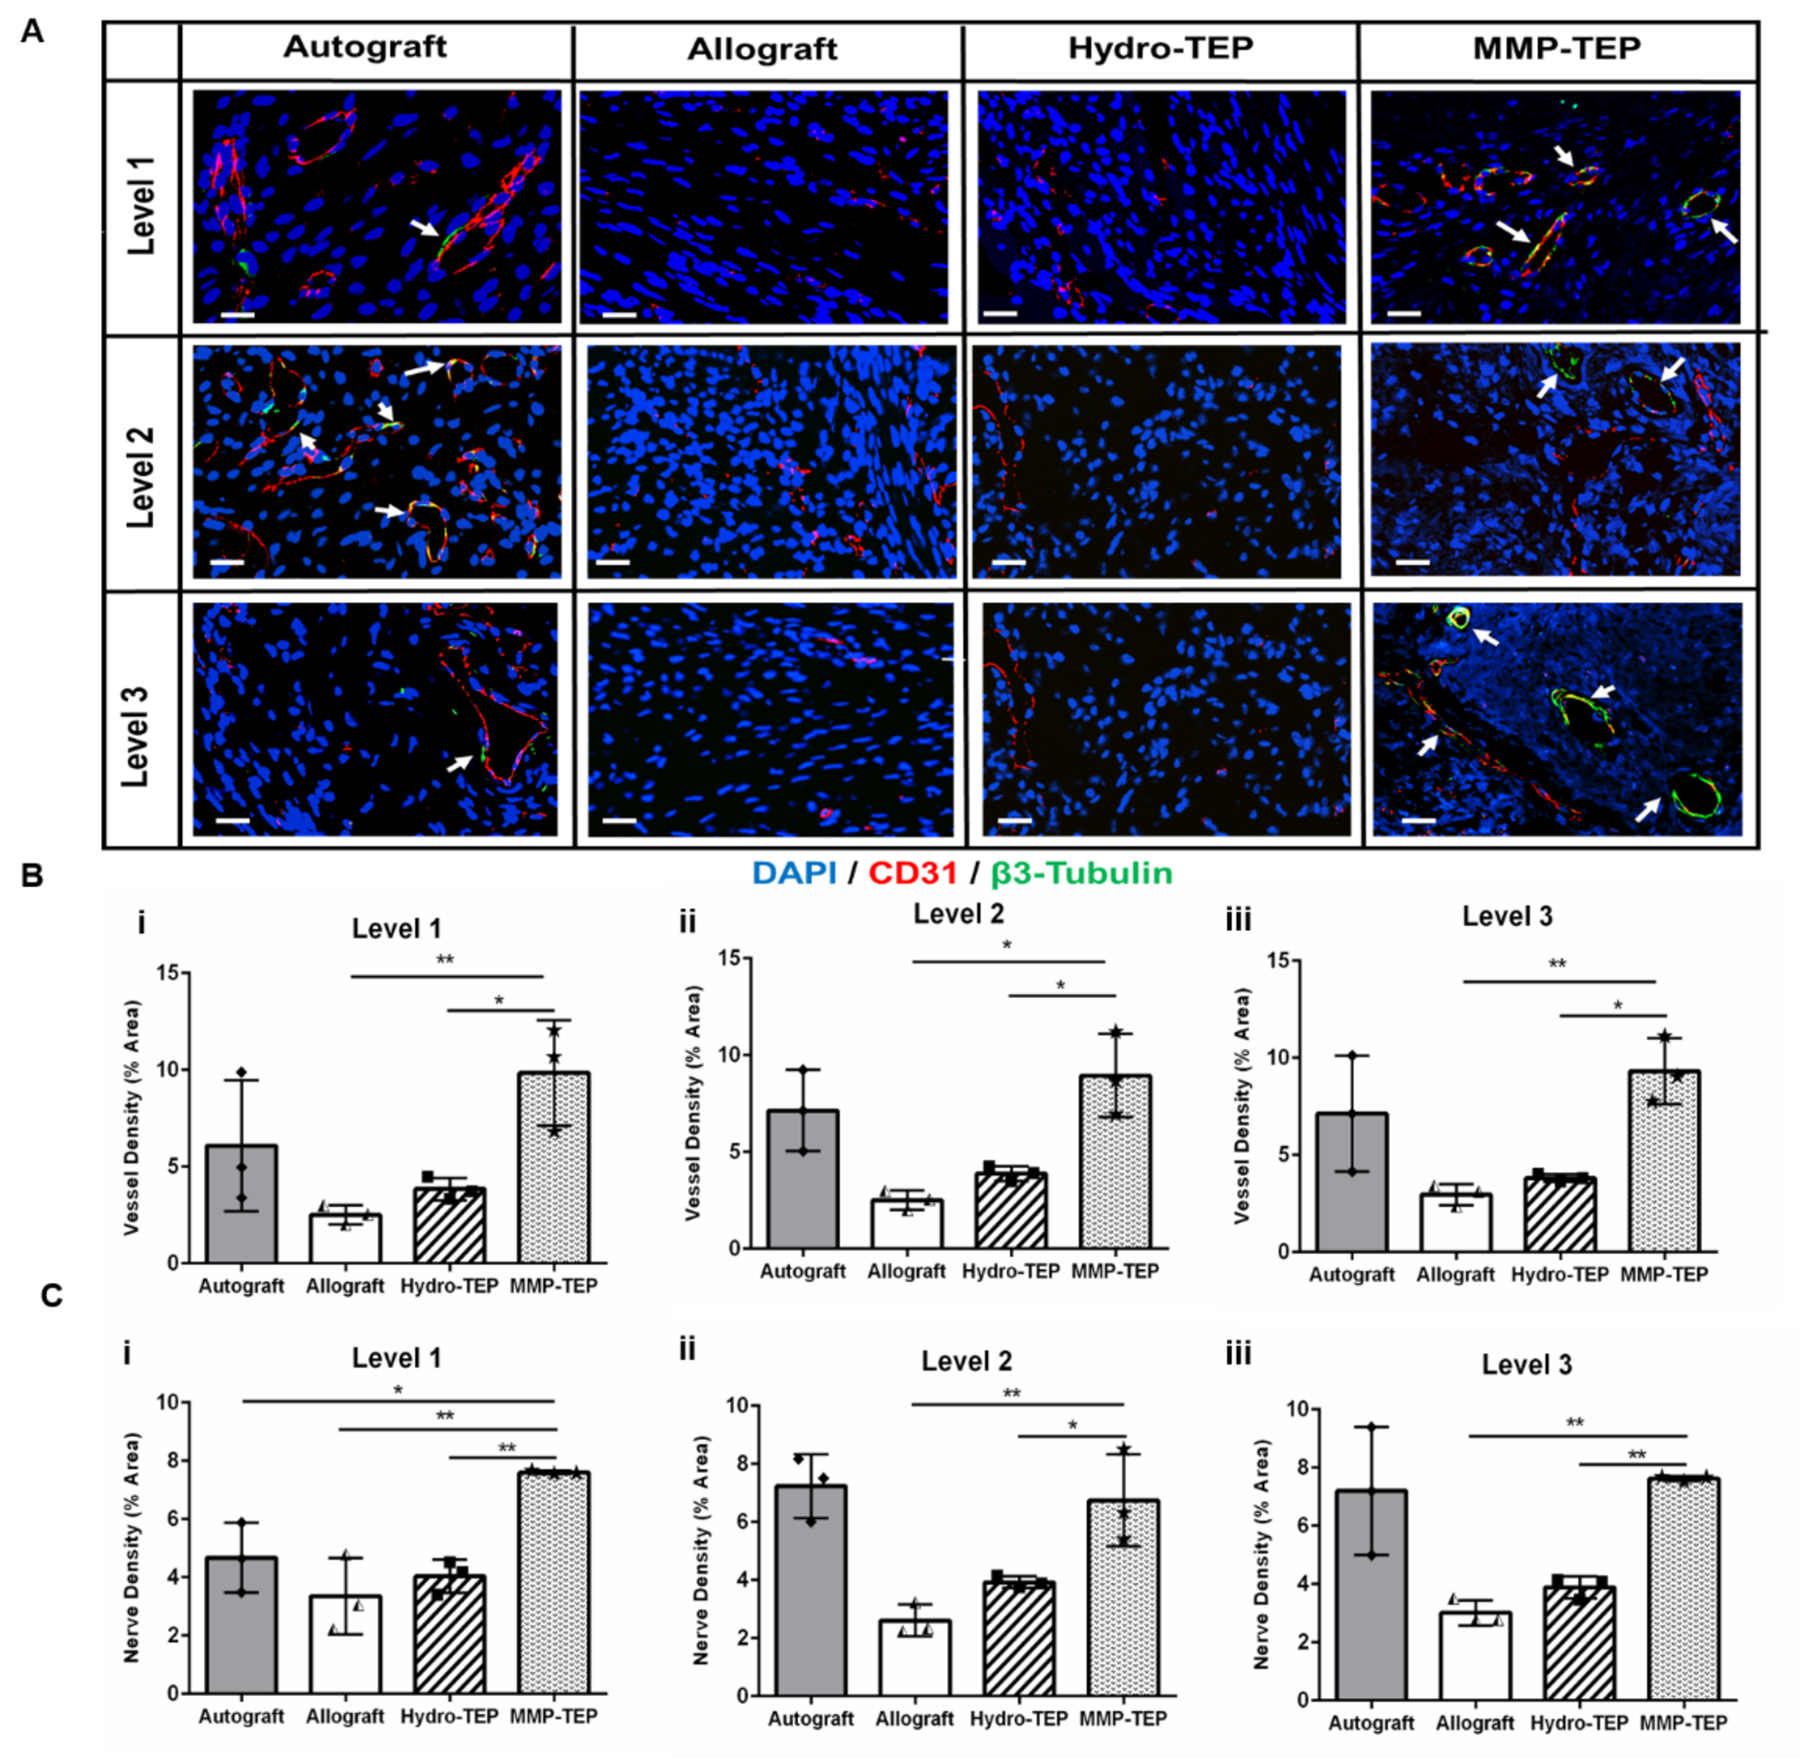
Figure 3.

(A) Representative confocal images of co-stained of CD31 (blood vessels, red) and β3-tubulin (nerves, green) on the crossections of allograft at levels proximal (Supplemental Fig. 1, Level 1), medial (Supplemental Fig. 1, Level 2), and distal (Supplemental Fig. 1, Level 3) in relation to the femoral head (scale bar = 20 μm). (B-C) Quantification of blood vesssel and nerve density in three levels repectively using one-way ANOVA with Dunnett’s post-hoc analysis, where n = 3, p < 0.05, p < 0.01, p < 0.001, p < 0.001 indicates significance compared to MMP-TEP (*, **, ***, ****).
