
Figure 6.
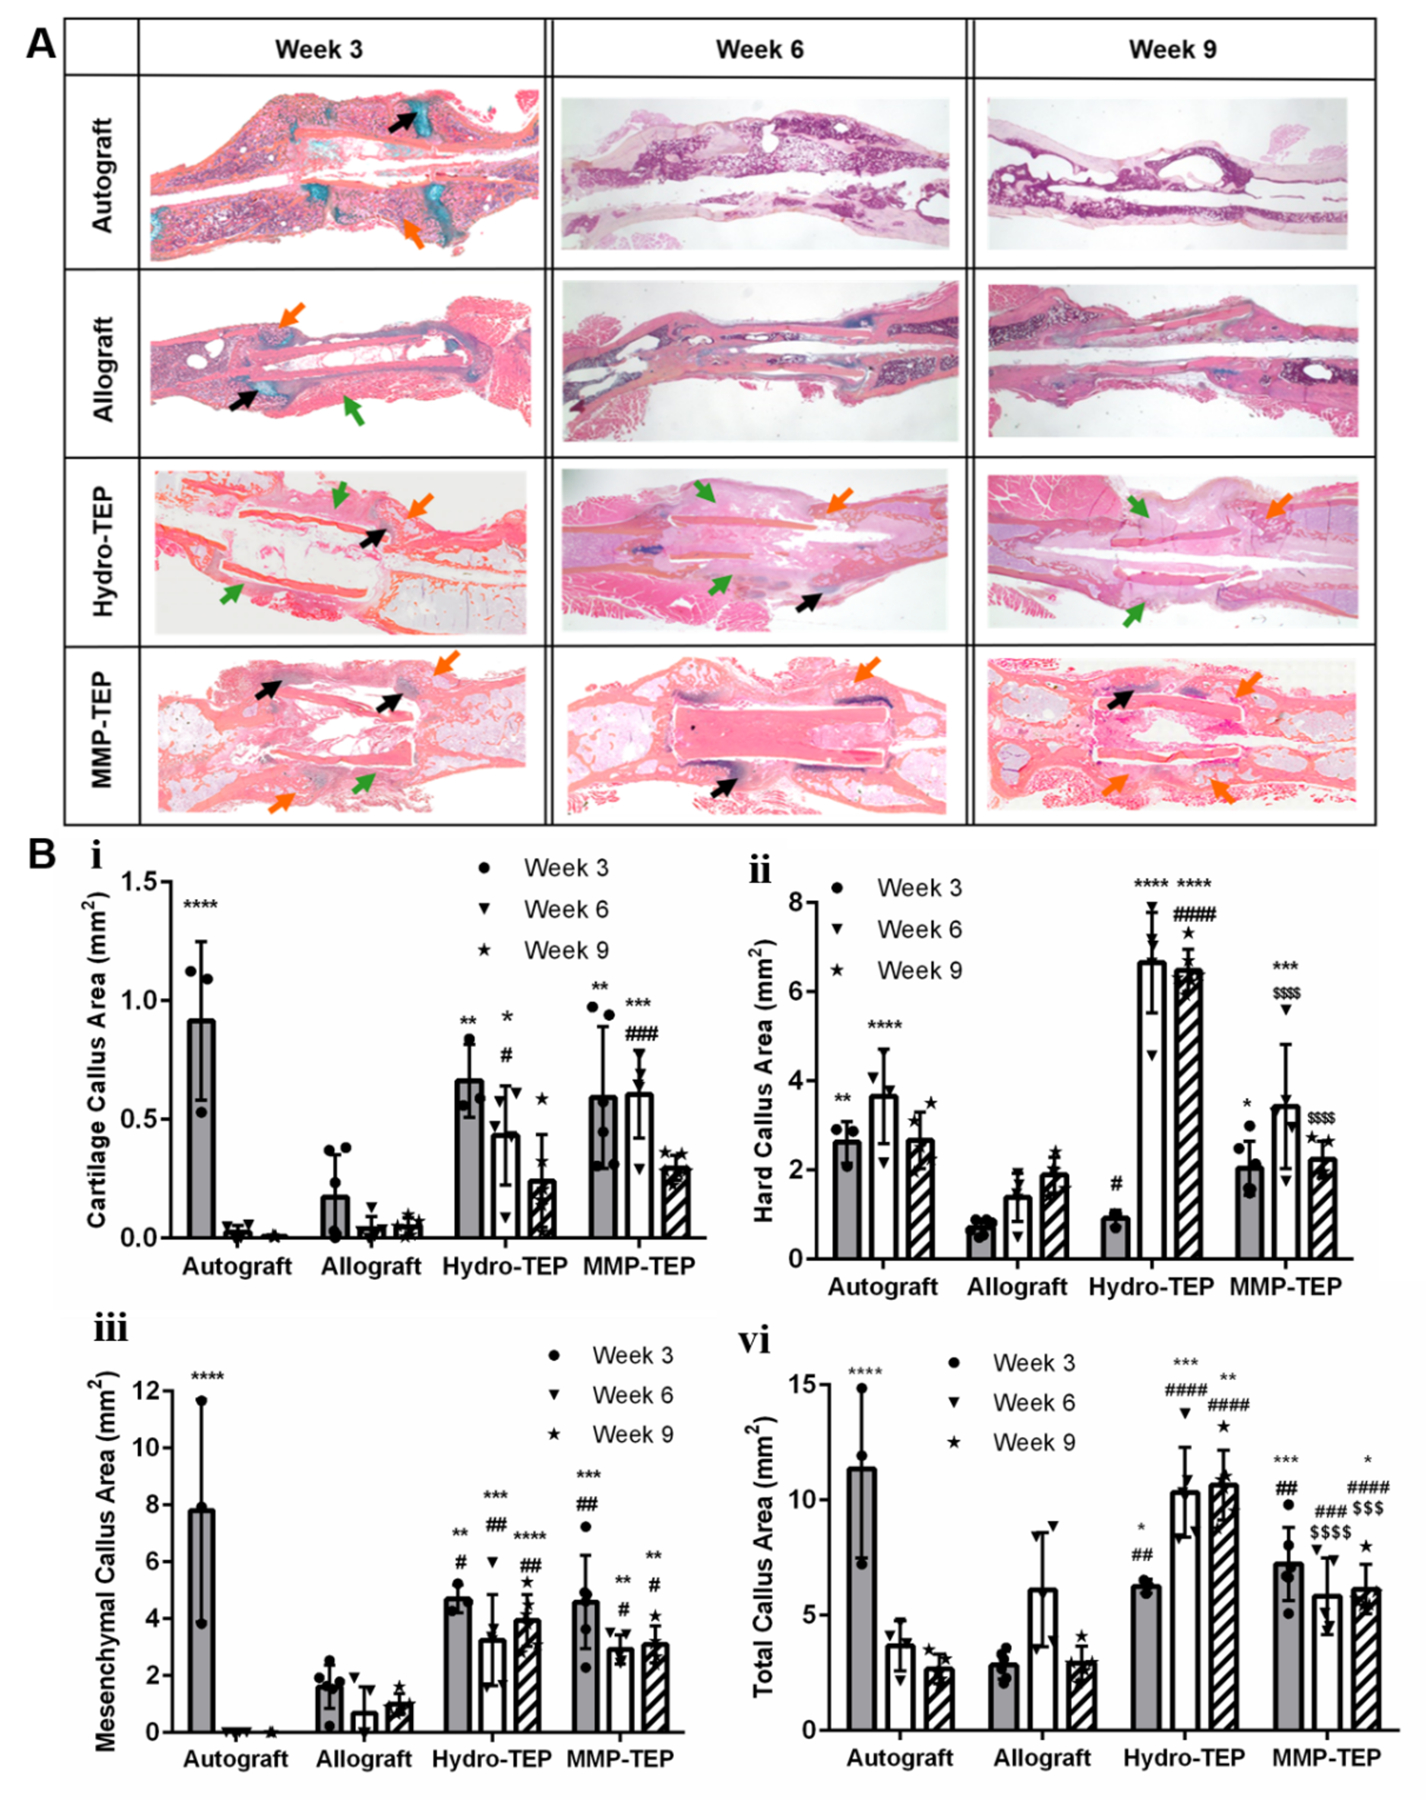
Representative images (A) and quantification of callus area (B) using two-way ANOVA with Tukey’s post-hoc analysis, where n = 3–6; error bars represent standard deviation; p < 0.05, p < 0.01, p < 0.001, and p < 0.0001 indicate significances compared to allograft (*, **, ***, ****), autograft (#, ##, ###, ####) and Hydro-TEP ($$$$$)). Histological analysis of grafted femur sections was performed using Alcian Blue (blue: glycosaminoglycans and proteoglycans, black arrow) and Orange G staining (orange: bone; pink: surrounding fibrotic tissue, orange arrow), where green arrow indicates mesenchymal callus (some quantification data are derived from our previously study(29).)