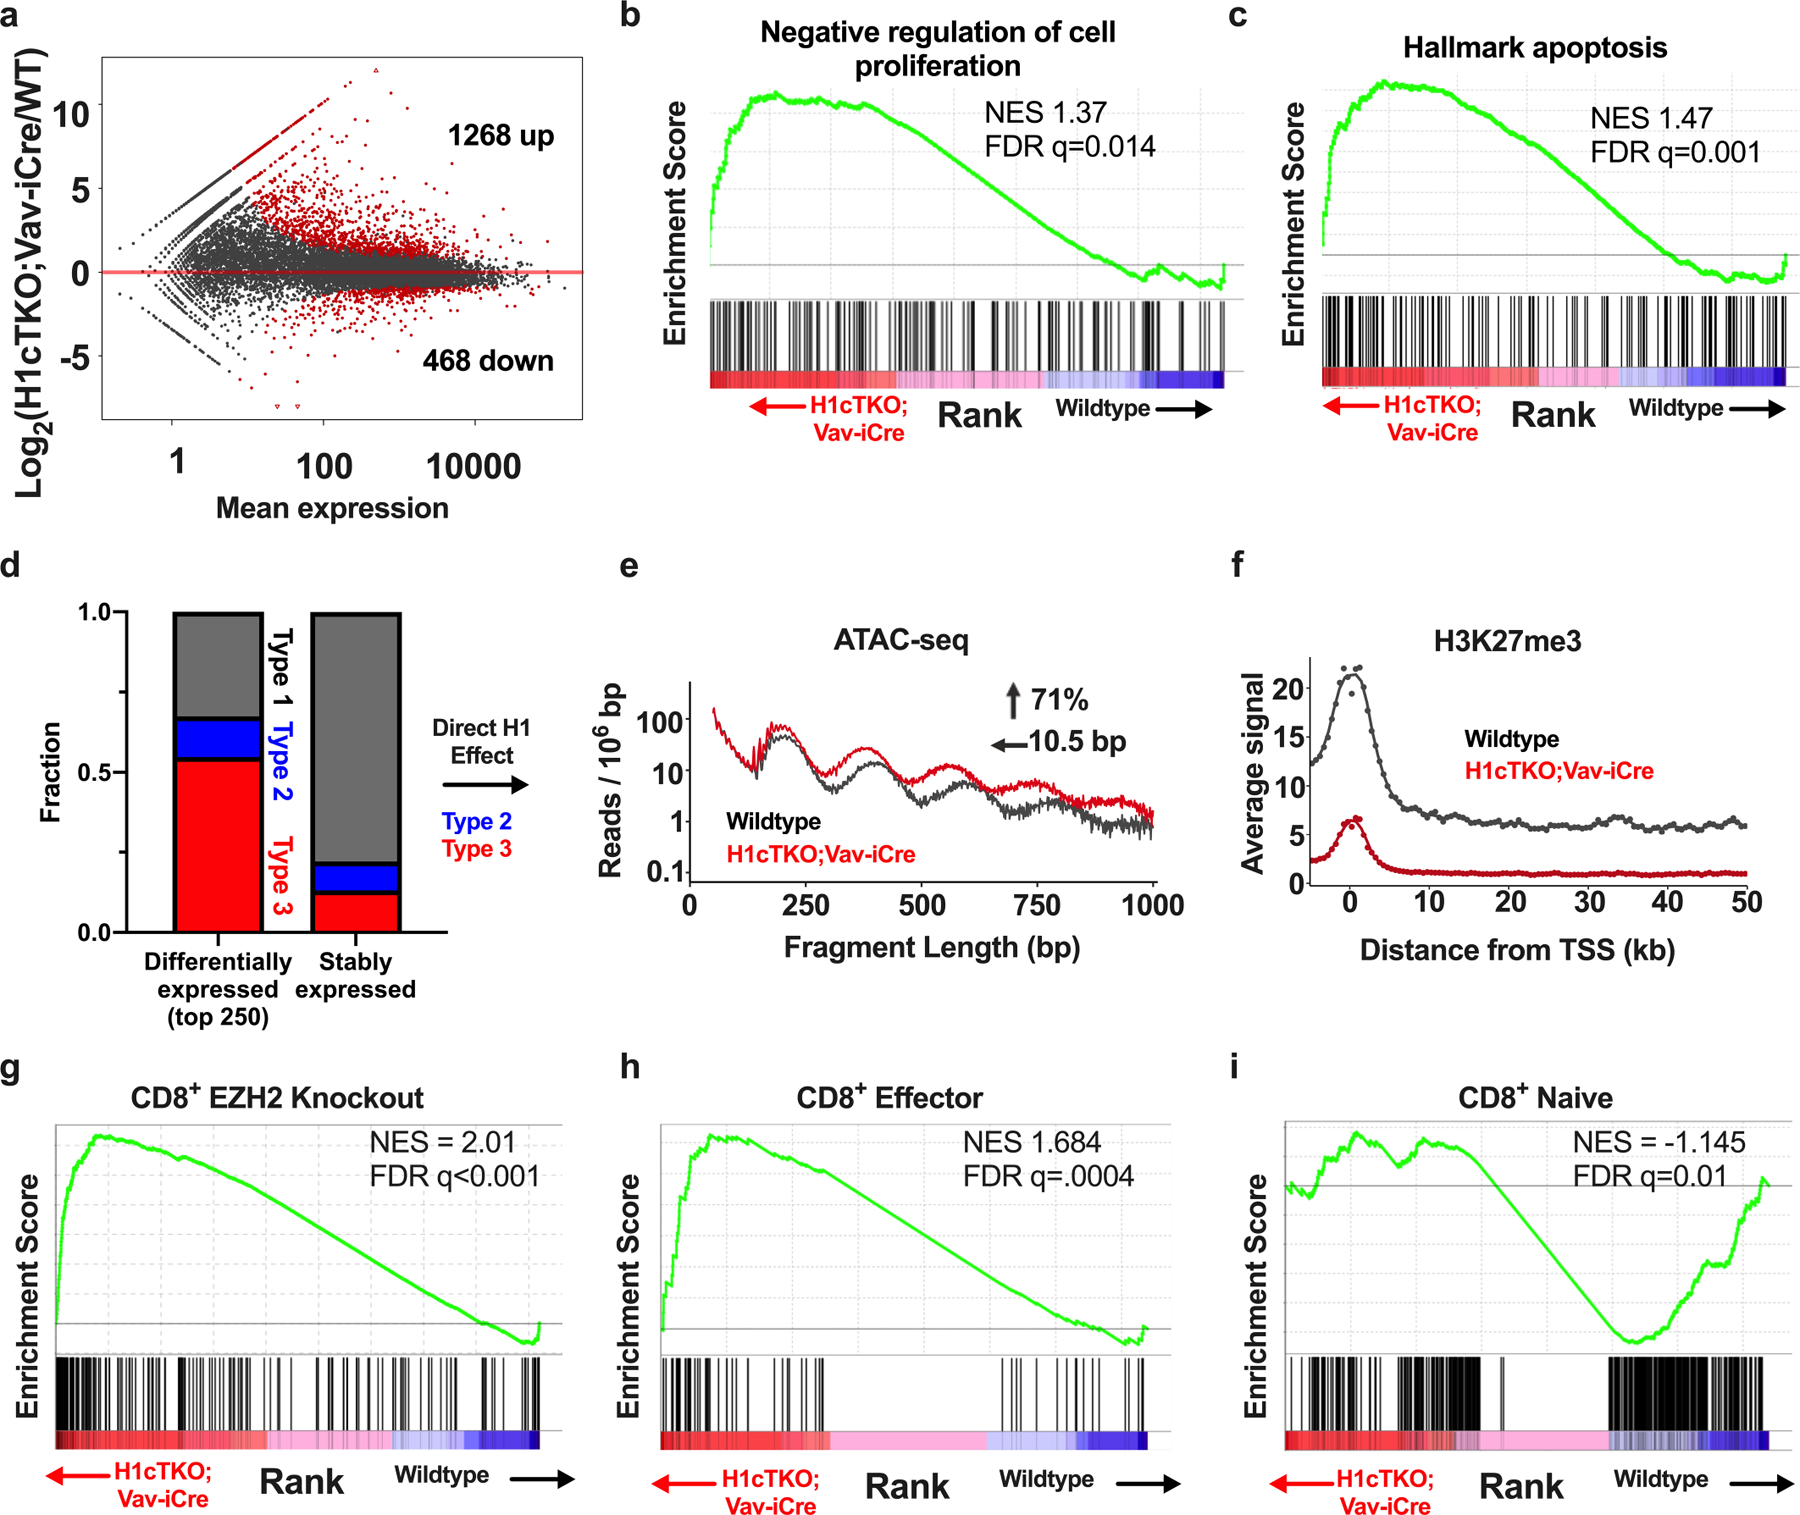
Extended Data Fig. 8 |. H1 depletion phenocopies loss of Ezh2 and H1 is required for compaction and epigenetic marking of genes controlling T cell activation.

a, Poly-A+ RNA-seq was performed on splenic CD8+ T cells from WT and H1cTKO;Vav-iCre mice. Sequencing reads were processed (see Methods) and quantified using DESeq2 and custom R scripts. Mean expression as a function of the fold change is plotted for each gene. Differentially expressed transcripts, indicated in red, were defined as those with an adjusted P value of <0.05. b, c, Quantified transcripts from poly-A+ RNA-seq of wild-type and H1cTKO;Vav-iCre CD8+ T cells were used as inputs for GSEA to determine significant overlaps between genes that are differentially regulated upon H1 depletion and gene sets within the GSEA database. Shown is an enrichment plot and scores of differentially expressed genes in a set of genes associated with negative regulation of cell proliferation (b) and apoptosis (c). d, RNA-seq was performed on CD8+ T cells from wild-type and H1cTKO;Vav-iCre mice and differentially expressed genes and genes unchanged in expression were identified using DESeq2. The 250 most upregulated genes compared with genes not exhibiting altered expression were selected using the adjusted P value. The chromatin “Type” of the TSS of each gene was determined by identifying the ChromHMM regions from our 15-state map that fell within a ± 200 bp window of each TSS and annotating each of these states with the assigned chromatin type. The fractional composition of chromatin types 1 (grey), 2 (blue) and 3 (red) was compared between the 250 most upregulated genes in H1cTKO;Vav-iCre compared to wild-type cells and genes that had unchanged expression. e, ATAC-seq was performed on wild-type (black) and H1cTKO;Vav-iCre (red) CD8+ T cells. ATAC-seq reads that fell within H1-dependent chromatin (Type 2 and Type 3) of the top 250 most differentially expressed genes were identified. ATAC-seq read lengths (bp) were calculated and the data are plotted as the number of reads for a given read length normalized to region size. The change in NRL and accessibility (area-under-the-curve) were calculated using NRLfinder. f, Regions surrounding the TSS of each of the top 250 most differentially expressed genes (analysed in a) were identified and stacked to create a “metagene plot.” The average ChIP-seq signal intensity for H3K27me3 in wild-type (black) and H1cTKO;Vav-iCre (red) CD8+ cells is shown for the metagene. g–i, Quantified transcripts from poly-A+ RNA-seq of wild-type and H1cTKO;Vav-iCre CD8+ T cells were used as inputs for GSEA to determine significant overlaps between genes that are differentially regulated upon H1 depletion and gene sets within the GSEA database. Shown are enrichment plots and scores of differentially expressed genes in a set of (g) EZH2 regulated genes in CD8+ T cells, (h) CD8+ effector T cell genes, and (i) CD8+ naive T cell genes. GSEA plots are shown with normalized enrichment scores and q-values. CD8+ effector and naive T cell gene sets are from Pace et al.29.
