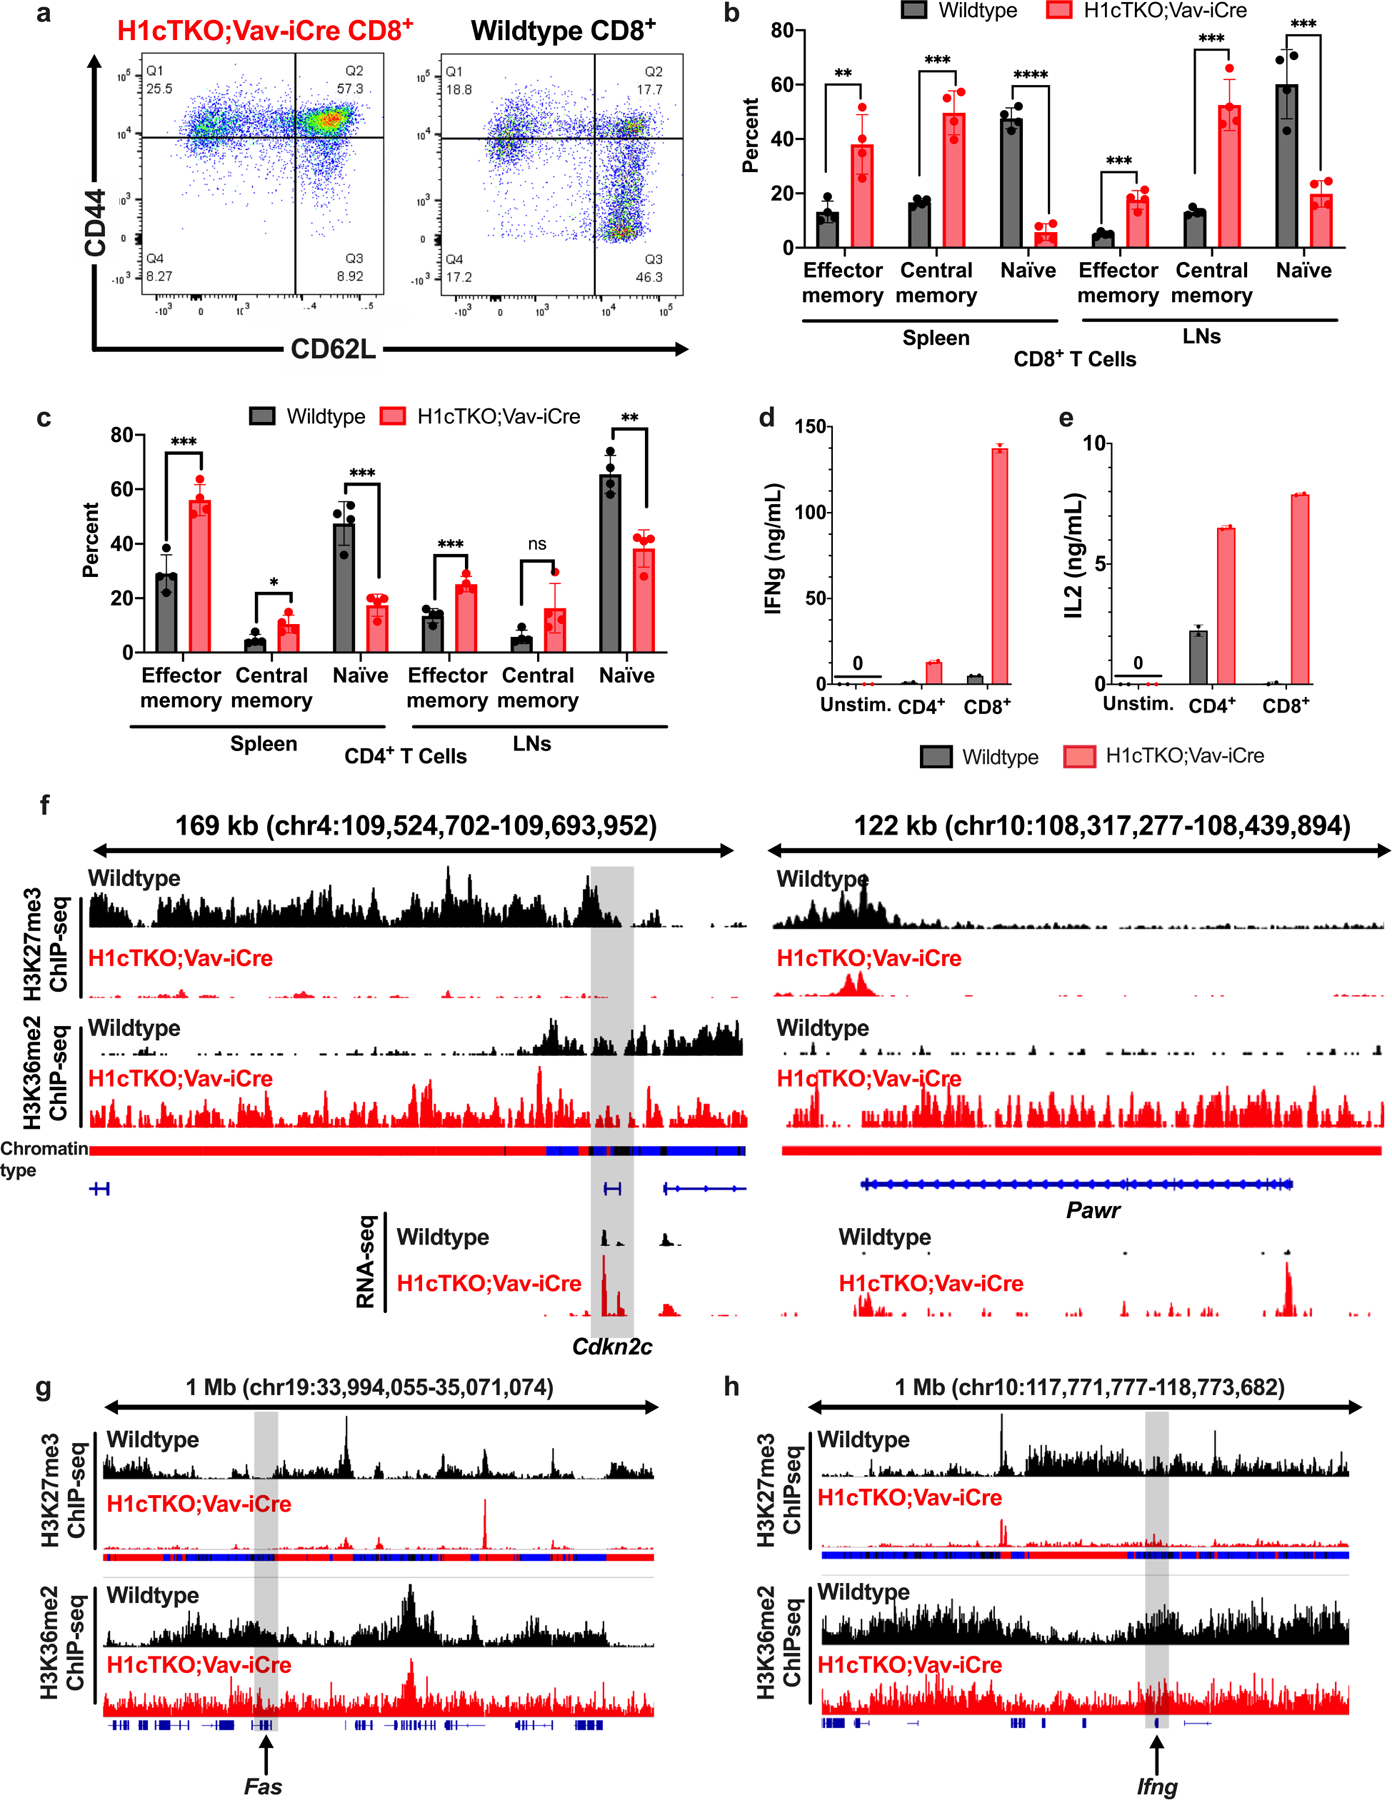
Extended Data Fig. 9 |. H1 depletion leads to de-repression of genes associated with T cell activation and apoptosis.

a, A single cell suspension was prepared from spleens of wild-type (right) and H1cTKO;Vav-iCre (left) mice and ACK lysis was performed to remove red blood cells. Cells were stained for CD8+ T cell markers (CD45+CD3e+CD8+) as well as markers for T cell activation, CD44 and CD62L, and analysed by flow cytometry. Representative flow plots are shown. b, c, Analysis of (b) CD8+ and (c) CD4+ lymphocyte cell types from spleen and LN of WT and H1cTKO;Vav-iCre mice. Shown is each cell type calculated as a percent of CD45+CD3e+CD8+ or CD45+CD3e+CD4+ (n = 4 for each genotype). d, e, CD8+ T cells were isolated from wild-type (n = 2 mice, black) and H1cTKO;Vav-iCre (n = 2 mice, red) mice by column purification. Cells were then stimulated in T cell medium containing anti-CD3e/28. After 22 h the medium was collected and the secretion of (d) IFNγ and (e) IL-2 was determined by ELISA. Data in b–e is mean ± s.d., unpaired t-test; ns, not statistically significant; *P ≤ 0.05; **P < 0.01; ***P < 0.001; ****P < 0.0001. f–h, H3K27me3 (top two tracks) and H3K36me2 (bottom two tracks) ChIP-seq signals in WT (black) and H1cTKO;Vav-iCre (red) CD8+ splenic T cells are shown for IGV genome browser views (mm10 genome assembly) containing the (f) Cdkn2c (left) and Pawr (right), Fas (g) and Ifng (h) genes. Shown are chromatin states (bars below the top two tracks) in wild-type CD8+ splenic T cells annotated as Type 1 (black), Type 2 (blue) and Type 3 (red), and quantified transcripts from poly-A+ RNA-seq (lowest two tracks). g, h, H3K27me3 (top two tracks) and H3K36me2 (bottom two tracks) ChIP-seq signals in WT (black) and H1cTKO;Vav-iCre (red) CD8+ splenic T cells are shown for a 1 Mb IGV genome browser view (mm10 genome assembly) containing the (g) Fas and (h) Ifng genes.
