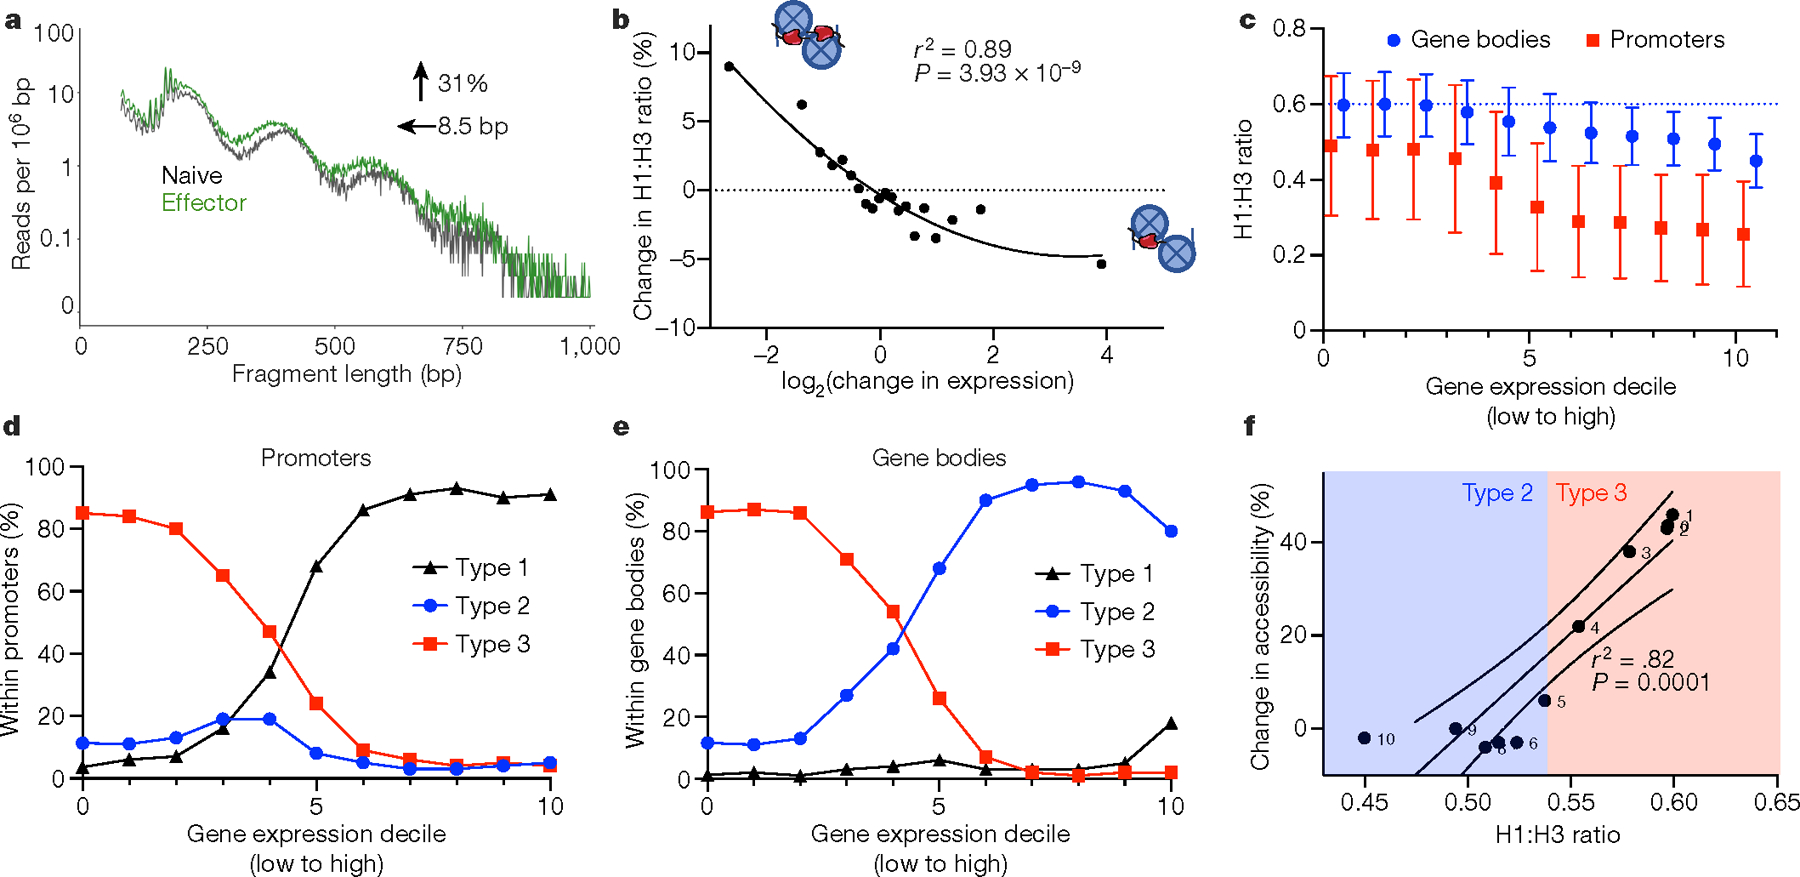
Fig. 4 |. H1 occupancy regulates gene expression in activated and resting T cells.

a, ATAC-seq read lengths were calculated from publicly available ATAC-seq data from naive (black) and effector (green) T cells of wild-type mice for all regions of upregulated gene bodies that fall completely within type 3 chromatin states. The data are plotted as the number of a given read length normalized to region size. The change in accessibility and NRL are shown as determined by NRLfinder. b, Change in H1 occupancy, as determined by the per cent change in the normalized H1 to H3 ratio between unstimulated and stimulated CD8+ T cells, as a function of the log2 change in gene expression between the two conditions. c, Normalized H1 occupancy in gene bodies (blue) and promoters (red) divided into deciles of gene expression in wild-type CD8+ T cells. H1 and H3 occupancy were determined using CUT&Tag and normalized as in Fig. 2h. Data are mean ± s.d. d, e, Fraction of type 1, type 2 or type 3 chromatin within promoters (d) or gene bodies (e) for each gene set, ordered by gene expression as in c. f, Alterations in accessibility as a function of the H1 to H3 ratio. Change in chromatin accessibility within each gene expression decile upon H1 depletion was calculated using NRLfinder and plotted as a function of the H1 to H3 ratio in wild-type CD8+ T cells. Type 2 and 3 chromatin designations of each gene expression decile are shown based on c. The solid line is the linear regression, and the dashed lines show the 95% confidence intervals.
