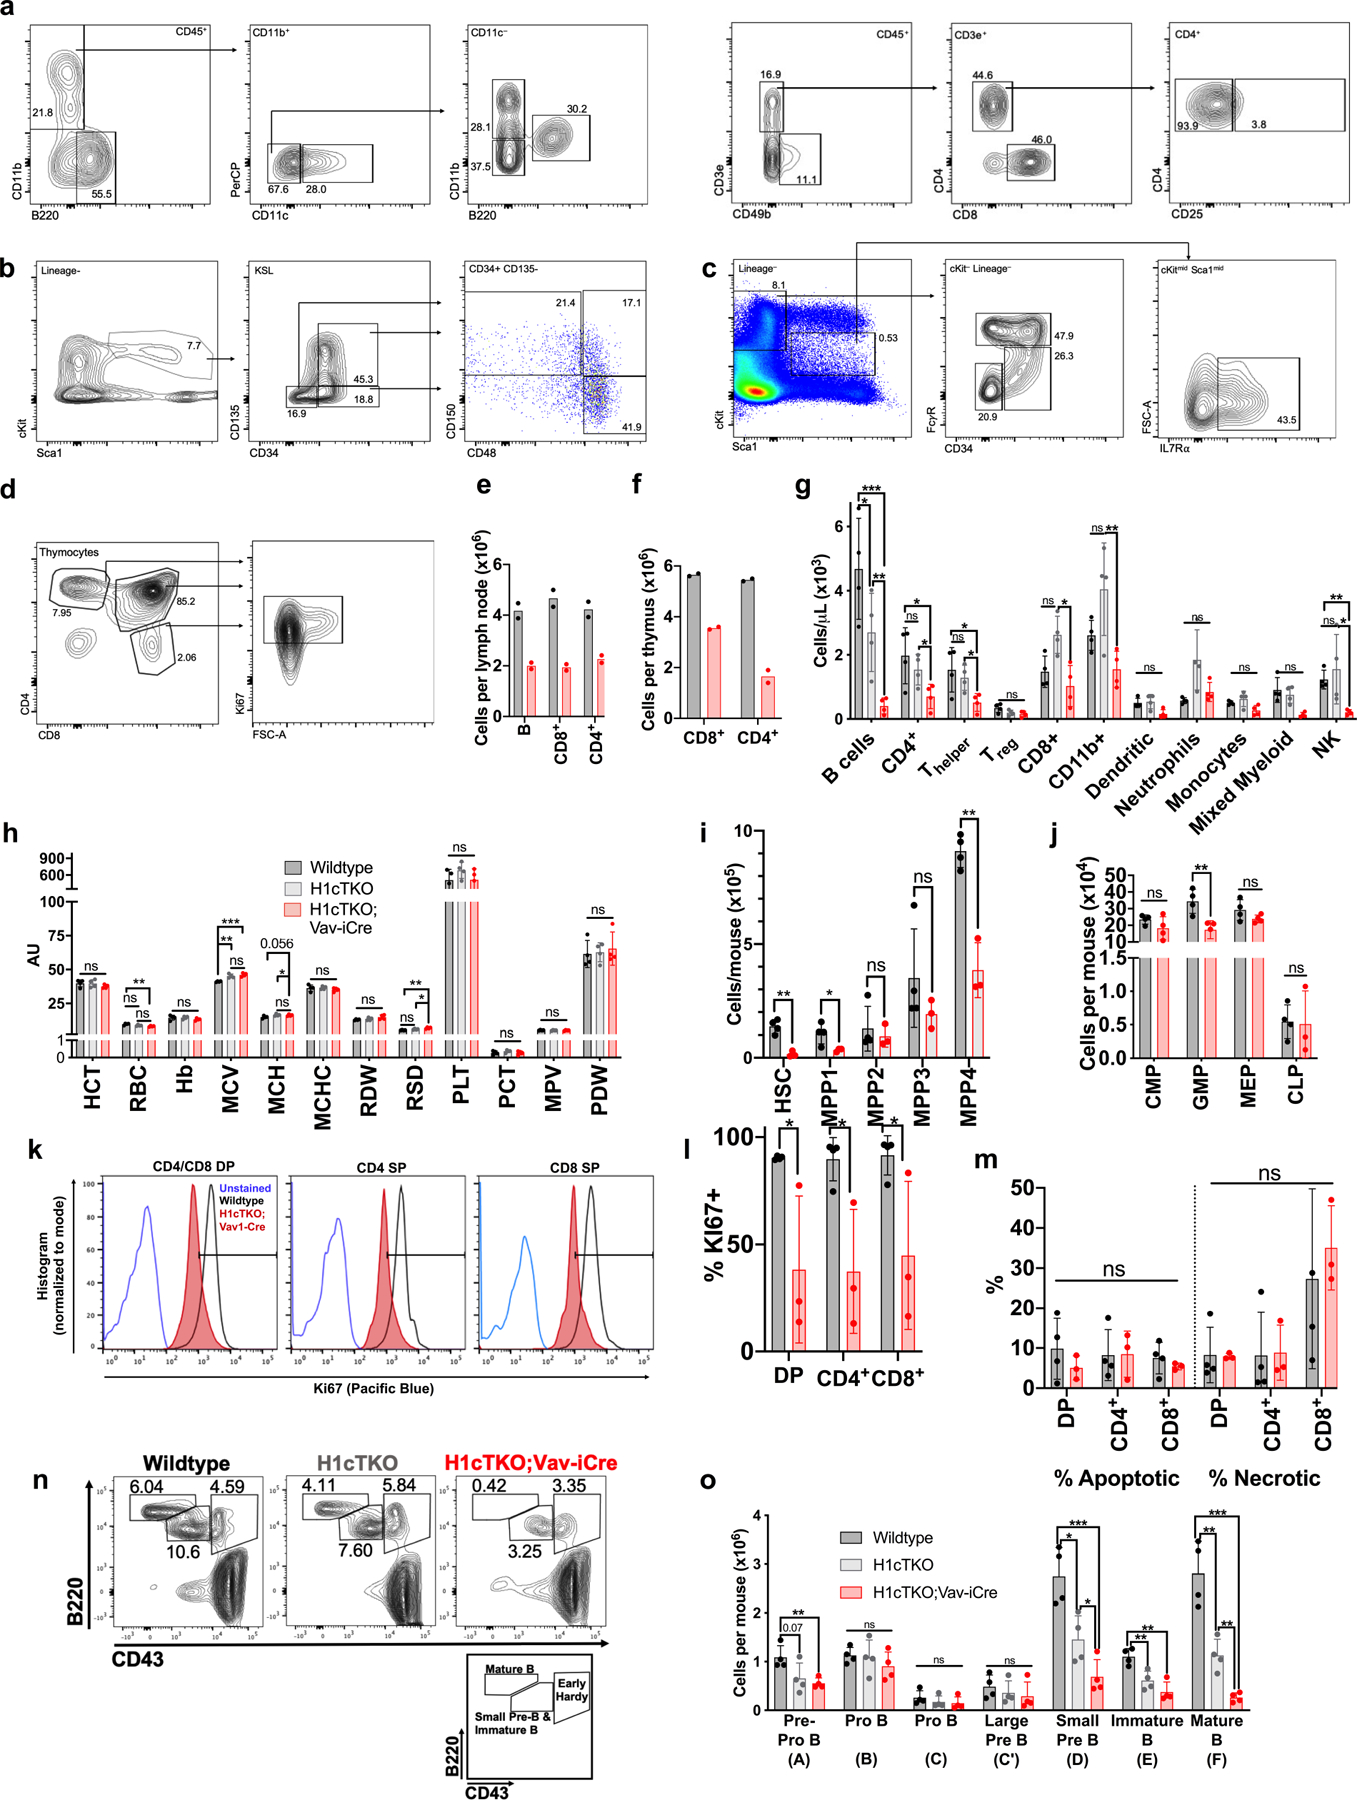
Extended Data Fig. 2 |. Analysis of haematopoietic cells in H1-depleted H1cTKO;Vav-iCre mice.

a, Flow cytometry strategy for identifying mature myeloid and lymphoid cell types in peripheral blood. Corresponds to g. Strategy was separated in two panels: B cells, dendritic cells, neutrophils, monocytes, and mixed myeloid (left), and NK and T cell populations (right). Corresponds to g. b, Flow cytometry gating strategy for the identification of HSCs and multipotent progenitors (MPPs). Corresponds to i. c, Flow cytometry gating strategy for the identification of the following lineage-specific progenitors; CMP, GMP, MEP and CLP. Corresponds to j. d, Flow cytometry gating strategy for measuring Ki67 positivity of CD4+ and CD8+ T cells. Corresponds to l. e, The total number of B cells, and CD4+ and CD8+ T cells in lymph nodes (LN) of WT and H1cTKO;Vav-iCre mice (n = 2) was measured by flow cytometry. f, The total number of CD4+ and CD8+ T cells in thymus of WT and H1cTKO;Vav-iCre mice (n = 2) was measured by flow cytometry. g, h, Peripheral blood obtained from the facial vein of WT, H1cTKO, and H1cTKO;Vav-iCre mice (n = 4) for analysis by flow cytometry and automated CBC (Oxford Scientific) showing (g) the total number of the indicated populations of mature lymphoid and myeloid cell types, and (h) normalized parameters of red blood cell and platelet count and morphology, as determined by CBC. T helper cells were defined as CD45+CD3e+CD49b−CD4+CD25−. Regulatory T (Treg) cells were defined as CD45+CD3e+CD49b−CD4+CD25+. i, Number of HSCs and various MPP populations in bone marrow of WT (n = 4) and H1cTKO;Vav-iCre (n = 3) mice. Surface markers used to define the various populations can be found in Supplementary Table 4. j, Number of myeloid and lymphoid progenitors in bone marrow of WT (n = 4) and H1cTKO;Vav-iCre (n = 4) mice. Surface markers for the identification of progenitors were as follows: CMP, CD34+ FcgR III/II− c-Kit+ Sca1− Lineage−; GMP, CD34+ FcgR III/II+ c-Kit+ Sca1− Lineage−; MEP, CD34− FcgR III/II− c-Kit+ Sca1− Lineage−; CLP, IL7R-α− (CD127)+ c-Kitmid Sca1mid Lineage−. k, l, Thymocytes were isolated from WT (n = 4) and H1cTKO;Vav-iCre (n = 3) mice and stained for the intranuclear antigen Ki67 for the examination of cellular proliferation. Representative Ki67 histogram is shown in k, quantification is shown in l. m, Thymocytes were isolated from WT (n = 4) and H1cTKO;Vav-iCre (n = 3) and stained for the surface marker Annexin V and propidium iodide for the assessment of apoptosis and necrosis. Staining was analysed by flow cytometry. n, Representative flow cytometry plots showing the number of small pre-B plus immature B cells, mature B cells, and early Hardy fraction cells as a percent of live cells in bone marrow from WT, H1cTKO, and H1cTKO;Vav-iCre mice. o, Hardy Fraction analysis of B cell maturation in bone marrow from WT (n = 4), H1cTKO (n = 4) and H1cTKO;Vav-iCre (n = 4) mice. The abundance of each population was calculated by multiplying the relative frequency of each population by bone marrow cellularity. Surface markers used to define the various populations can be found in Supplementary Table 4. Data are mean ± s.d., unpaired t-test, ns, not statistically significant; *P ≤ 0.05; **P < 0.01; ***P < 0.001; ****P < 0.0001.
