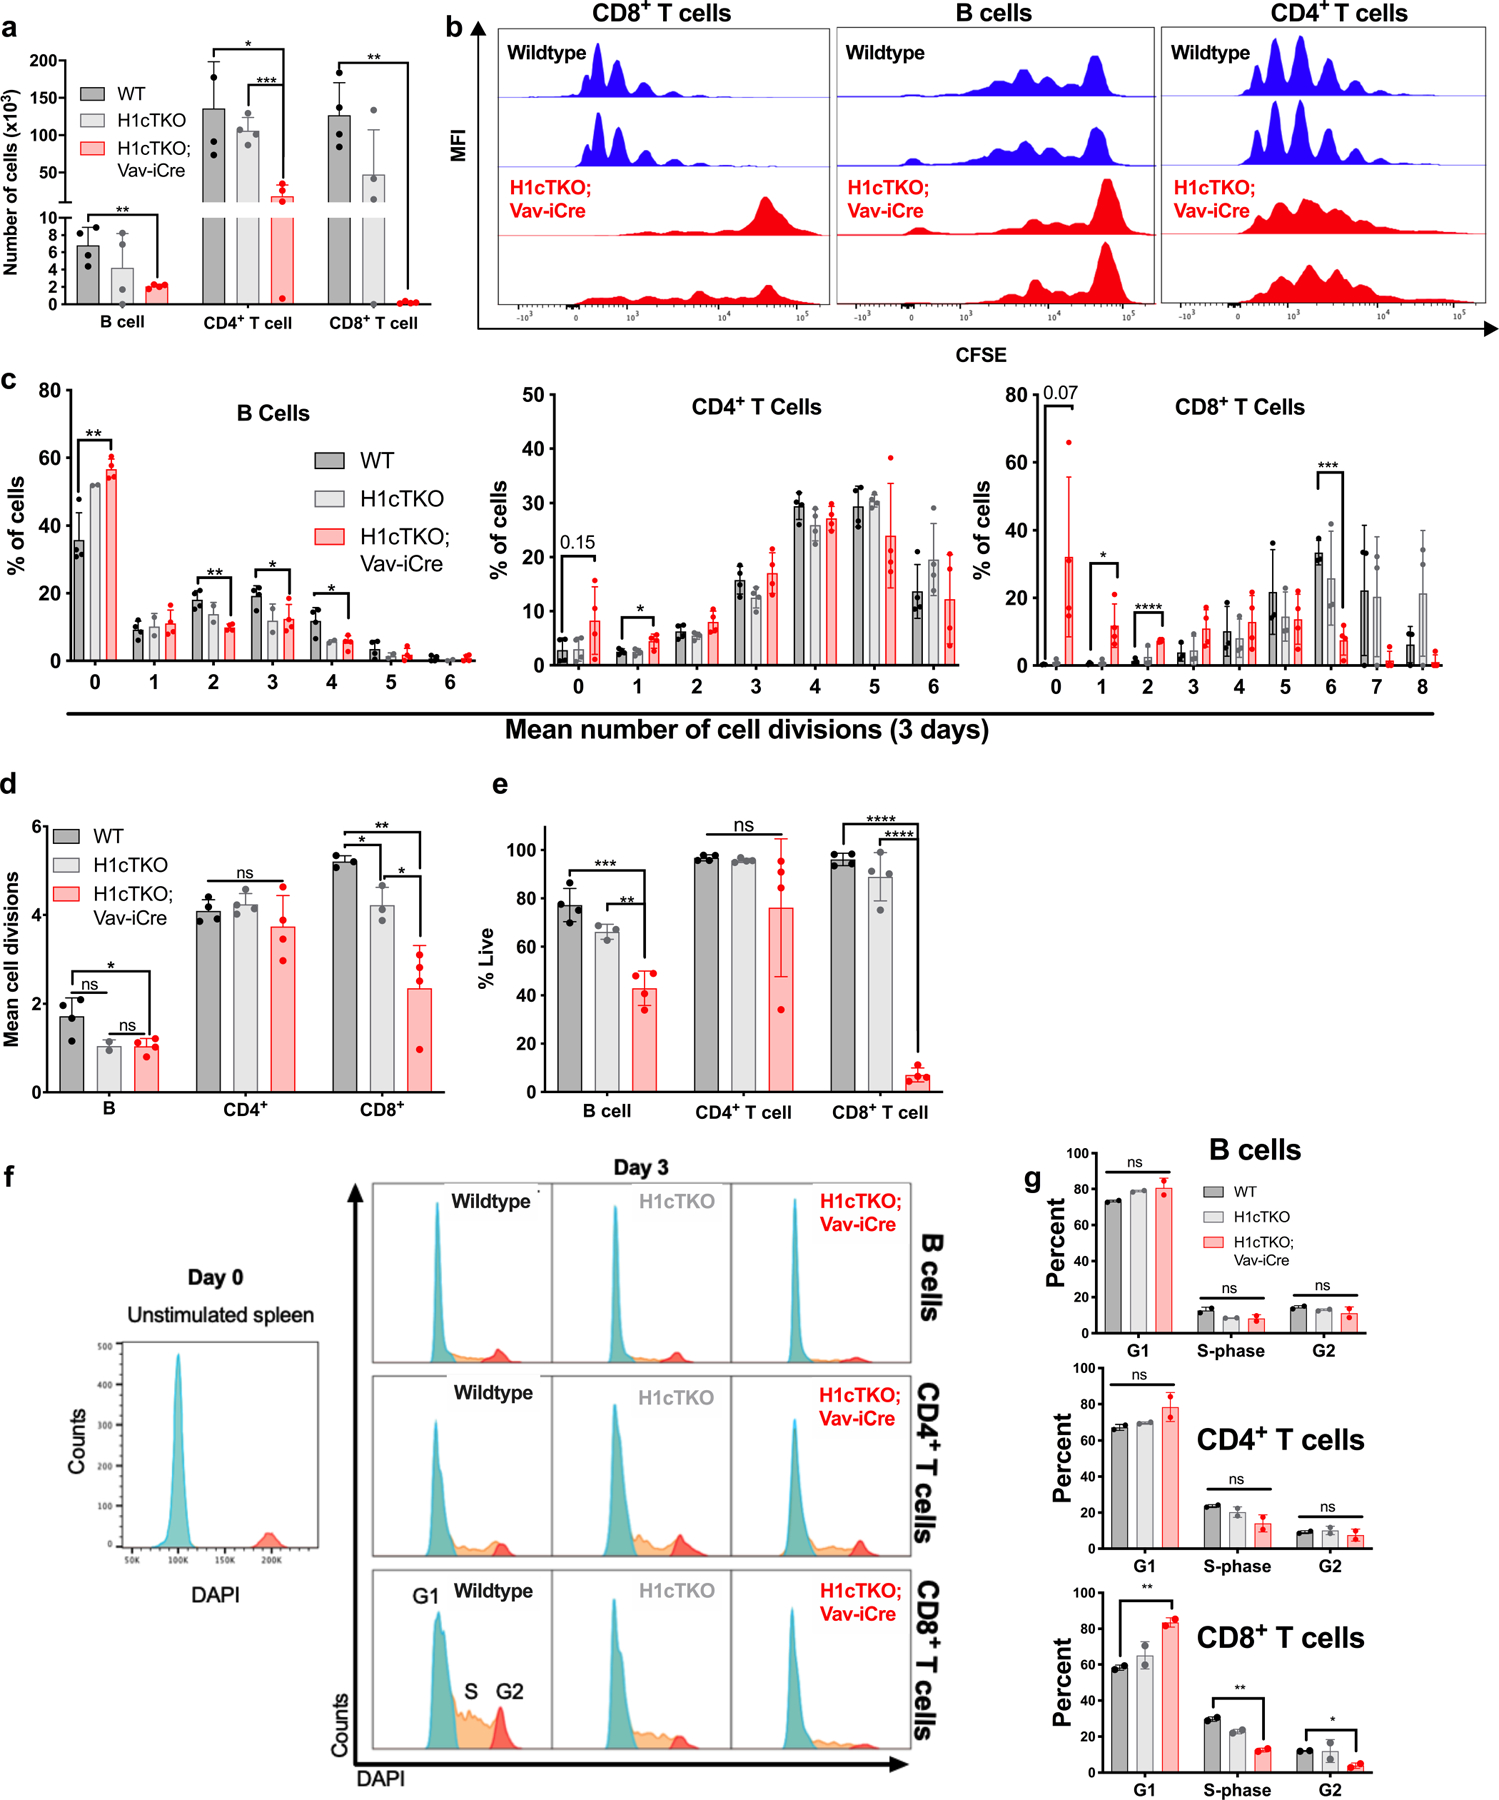
Extended Data Fig. 3 |. Ex vivo proliferation and cell cycle analysis of WT, H1cTKO and H1cTKO;Vav-iCre B and T cells.

a–e, 50,000 splenic B and 25,000 splenic T cells were isolated by FACS and stained with CellTrace Violet for 30 min at 37 °C in PBS and then washed and plated in stimulation media. B cells were stimulated with IL-4 and LPS. T cells were stimulated with CD3/CD28 beads and IL-2. All cells were cultured for 3 days. Cell division was measured by flow cytometry analysis. Cells derived from n = 4 mice per genotype. a, Cell output of B cells and CD4+ and CD8+ T cells isolated from WT, H1cTKO and H1cTKO;Vav-iCre mice was determined by flow cytometry using AccuCheck beads. b, Representative plots for CD8+ T cells, B cells and CD4+ T cells. c–e, Quantitation of cell divisions (c), mean cell divisions (d) and viability (e) in B cells, and CD4+ and CD8+ T cells are shown. f, g, 2 × 10⁶ splenic B and 1 × 10⁶ splenic T cells were isolated by FACS and stimulated for two days before cell cycle analysis. B cells were stimulated with IL-4 and LPS. T cells were stimulated with CD3/CD28 beads and IL-2. For cell cycle analysis, cells were permeabilized, stained with DAPI and analysed by flow cytometry. f, Representative histograms of DAPI staining in WT, H1cTKO and H1cTKO;Vav-iCre B, CD4+ and CD8+ T cells. Phases of the cell cycle are indicated. g, Quantification of cell cycle phases in c in WT, H1cTKO and H1cTKO;Vav-iCre B, CD4+ and CD8+ T cells (n = 4). Data are mean ± s.d., n = 4 mice per genotype; unpaired t-test; ns, not significant, P ≤ 0.05; **P < 0.01; ***P < 0.001; ****P < 0.0001.
