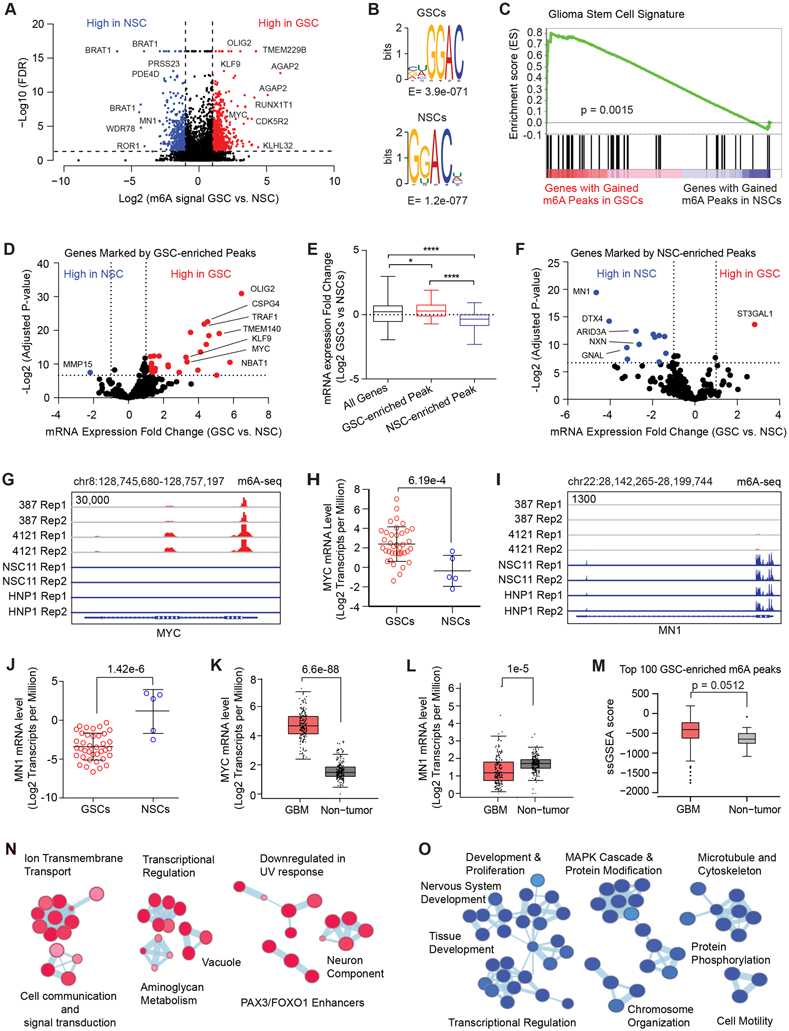
Figure 1: Cancer-specific genes, upregulated in glioblastoma stem cells are marked by RNA m6A modification. See also Figure S1.

A, Volcano plot of m6A peaks detected by meRIP-seq in two GSCs and two NSCs. Red dots indicate m6A peaks gained in GSCs while blue dots indicate m6A peaks gained in NSCs. Note that multiple peaks may map to the same gene. B, (Top) Top RNA motif enriched in m6A peaks in GSCs. (Bottom) Top RNA motif enriched in m6A peaks in NSCs. C, Gene set enrichment analysis of genes with GSC-enriched m6A peaks for a “glioma stem cell” signature. D, Volcano plot showing differential mRNA expression fold change between a panel of 38 GSCs and 5 NSCs for genes marked by GSC-enriched m6A peaks. Data was derived from Mack et al. (8). E, Differential mRNA expression fold change between a panel of 38 GSCs and 5 NSCs for all genes, genes marked by GSC-enriched m6A peaks, and genes marked by NSC-enriched m6A peaks. F, Volcano plot showing differential mRNA expression fold change between a panel of 38 GSCs and 5 NSCs for genes marked by NSC-enriched m6A peaks. Data was derived from Mack et al (8). G, m6A signal in two GSCs and two NSCs at the MYC locus. H, MYC mRNA expression (Log2 transcripts per million) in a panel of 38 GSCs and 5 NSCs. The DESeq2 package was used to calculate statistical significance with multiple test correction, p = 6.19e-4. I, m6A signal in two GSCs and two NSCs at the MN1 locus. J, MN1 mRNA expression (Log2 transcripts per million) in a panel of 38 GSCs and 5 NSCs. The DESeq2 package was used to calculate statistical significance with multiple test correction, p = 1.42e-6. K, MYC mRNA expression (Log2 transcripts per million) in a panel of glioblastoma tissue specimens (n = 163) and normal brain samples (n = 207). Four-way analysis of variance (ANOVA), using sex, age, ethnicity and disease state was used to calculate statistical significance, p = 6.6e-88. Data were derived from GEPIA (80). L, MN1 mRNA expression (Log2 transcripts per million) in a panel of glioblastoma tissue specimens (n = 163) and normal brain samples (n = 207). Four-way analysis of variance (ANOVA), using sex, age, ethnicity and disease state was used to calculate statistical significance, p = 1.0e-5. Data were derived from GEPIA (80). M, A single sample gene set enrichment analysis (ssGSEA) score was calculated based on expression of the genes marked with the top 100 m6A peaks in GSCs. The signature score was compared between glioblastoma and non-tumor specimens derived from TCGA datasets. N, Pathway enrichment bubble plot of gene sets enriched among genes marked by GSC-enriched m6A peaks. O, Pathway enrichment bubble plot of gene sets enriched among genes marked by NSC-enriched m6A peaks.
