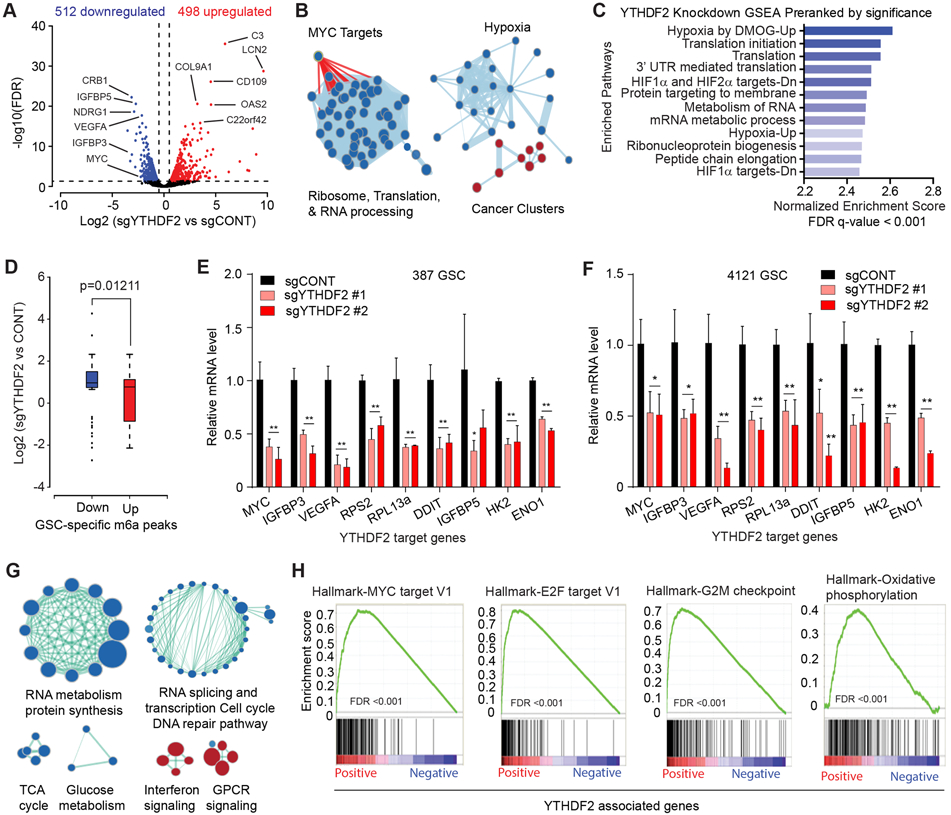
Figure 3. YTHDF2 supports gene expression of important cancer-specific pathways in GSCs. See also Figure S3.

A, Volcano plot of gene expression changes in YTHDF2 knockout vs. control, obtained from 387 and 4121 GSCs. Blue indicates genes downregulated in YTHDF2 knockout at an FDR < 0.05 and log2 fold change < −1. Red indicates genes upregulated following YTHDF2 knockout at an FDR < 0.05 and log2 fold change >1. B, Gene set enrichment analysis of GO pathways enriched or depleted following YTHDF2 knockdown in 387 and 4121 GSCs. Blue indicates enrichment in genes downregulated following YTHDF2 knockdown. Red indicates programs enriched in genes upregulated after YTHDF2 knockdown. C, Gene set enrichment analysis of genes downregulated following YTHDF2 knockdown in 387 and 4121 GSCs. Enriched gene signatures are plotted with normalized enrichment score. D, Boxplot demonstrating changes in gene expression with YTHDF2 knockdown in 387 and 4121 GSCs, compared with m6A differential peaks in GSCs vs. NSCs. The x-axis indicates m6A peaks downregulated (blue) or upregulated (red) in GSCs. The y-axis represents gene expression in YTHDF2 knockdown vs. control. E, Relative mRNA expression of YTHDF2 target genes normalized to 18S mRNA level in 387 GSCs. *, p < 0.05, **, p < 0.01. Error bars show standard deviation. F, Relative mRNA expression of YTHDF2 target genes normalized to 18S mRNA level in 4121 GSCs. *, p < 0.05, **, p < 0.01. Error bars show standard deviation. G, Gene set enrichment analysis of GO pathways positively or negatively correlated with YTHDF2 expression in TCGA dataset. Blue indicates enrichment in programs positively correlated and red indicates programs enriched in negatively correlated genes with YTHDF2 expression. H, Gene set enrichment analysis of Hallmark gene sets using a pre-ranked gene list weighted by correlation of gene expression with YTHDF2 in TCGA.
