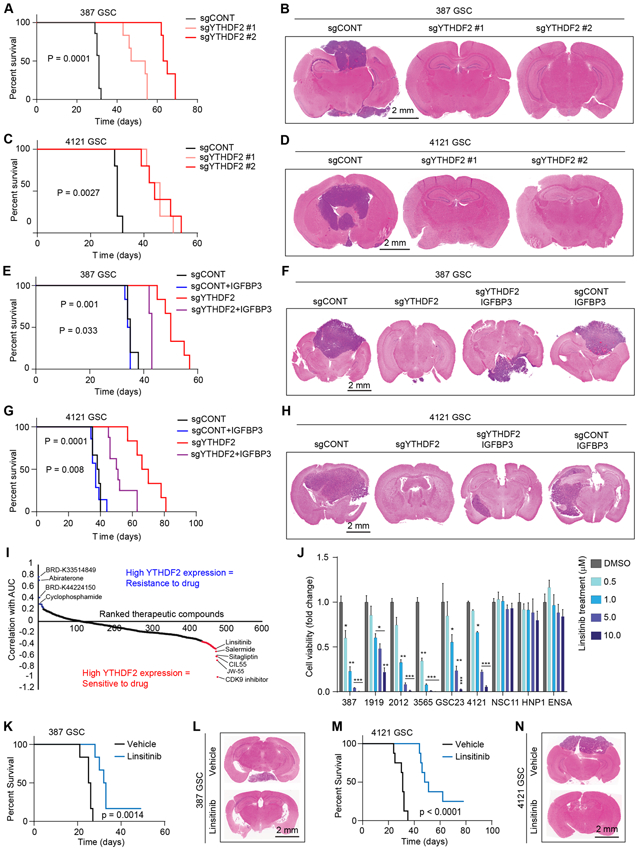
Figure 7. YTHDF2-MYC-IGFBP3 axis promotes in vivo tumor growth and has therapeutic potential in GSCs. See also Figure S8 and S9.

A, Kaplan-Meier survival curves of immunocompromised mice bearing intracranial 387 GSC transduced with sgCONT, sgYTHDF2 #1 or sgYTHDF2 #2. B, Representative images of hematoxylin and eosin-stained sections of tumor-bearing brains. Tumors were derived from 387 GSC transduced with sgYTHDF2#1, sgYTHDF2#2 or sgCONT. Brains were harvested after the appearance of first neurological sign in any cohort. Scale bar: 2 mm. C, Kaplan-Meier survival curves of immunocompromised mice bearing intracranial 4121 GSC transduced with sgCONT, sgYTHDF2 #1 or sgYTHDF2 #2. D, Representative images of hematoxylin and eosin-stained sections of tumor-bearing brains. Tumors were derived from 4121 GSC transduced with sgYTHDF2#1, sgYTHDF2#2 or sgCONT. Brains were harvested after the appearance of first neurological sign in any cohort. Scale bar: 2 mm. E, Kaplan-Meier survival curves of immunocompromised mice bearing intracranial 387 GSC transduced with sgYTHDF2 or sgCONT, in the presence or absence of IGFBP3 overexpression. F, Representative images of hematoxylin and eosin-stained sections of tumor-bearing brains. Tumors were derived from 387 GSC transduced with sgYTHDF2 or sgCONT, in the presence or absence of IGFBP3 overexpression. Brains were harvested after the presentation of first neurological sign in any cohort. Scale bar: 2 mm. G, Kaplan-Meier survival curves of immunocompromised mice bearing intracranial 4121 GSC transduced with sgYTHDF2 or sgCONT, in the presence or absence of IGFBP3 overexpression. H, Representative images of hematoxylin and eosin-stained sections of tumor-bearing brains. Tumors were derived from 4121 GSC transduced with sgYTHDF2 or sgCONT, in the presence or absence of IGFBP3 overexpression. Brains were harvested after the presentation of first neurological sign in any cohort. Scale bar: 2 mm. I, Therapeutic efficacy prediction of all drugs in brain cancer cells in the CTRP dataset based on mRNA expression of YTHDF2. Plot shows ranked therapeutic compounds based on correlation between YTHDF2 expression and area under the curve (AUC) of each drug. J, Cell viability of five patient-derived GSCs (387, 1919, 2012, 3565, GSC23 and 4121) and three NSCs (NSC11, HNP1 and ENSA) following a five day treatment of vehicle control (DMSO) and various concentrations of linsitinib. *, p < 0.05, **, p < 0.01, ***, p < 0.001, Error bars show standard deviation. K, Kaplan-Meier survival curves of immunocompromised mice bearing intracranial 387 GSC, which received orally, vehicle or linsitinib (50 mg/kg body weight). L, Representative images of hematoxylin and eosin-stained sections of tumor-bearing brains. Brains were harvested after the presentation of first neurological sign in any cohort. Tumors were derived from 387 GSC and mice were treated orally with either vehicle or linsitinib (50 mg/kg body weight). Scale bar: 2 mm. M, Kaplan-Meier survival curves of immunocompromised mice bearing intracranial 4121 GSC, which received orally, vehicle or linsitinib (50 mg/kg body weight). N, Representative images of hematoxylin and eosin-stained sections of tumor-bearing brains. Brains were harvested after the presentation of first neurological sign in any cohort. Tumors were derived from 4121 GSC and mice were treated orally with either vehicle or linsitinib (50 mg/kg body weight). Scale bar: 2 mm.
