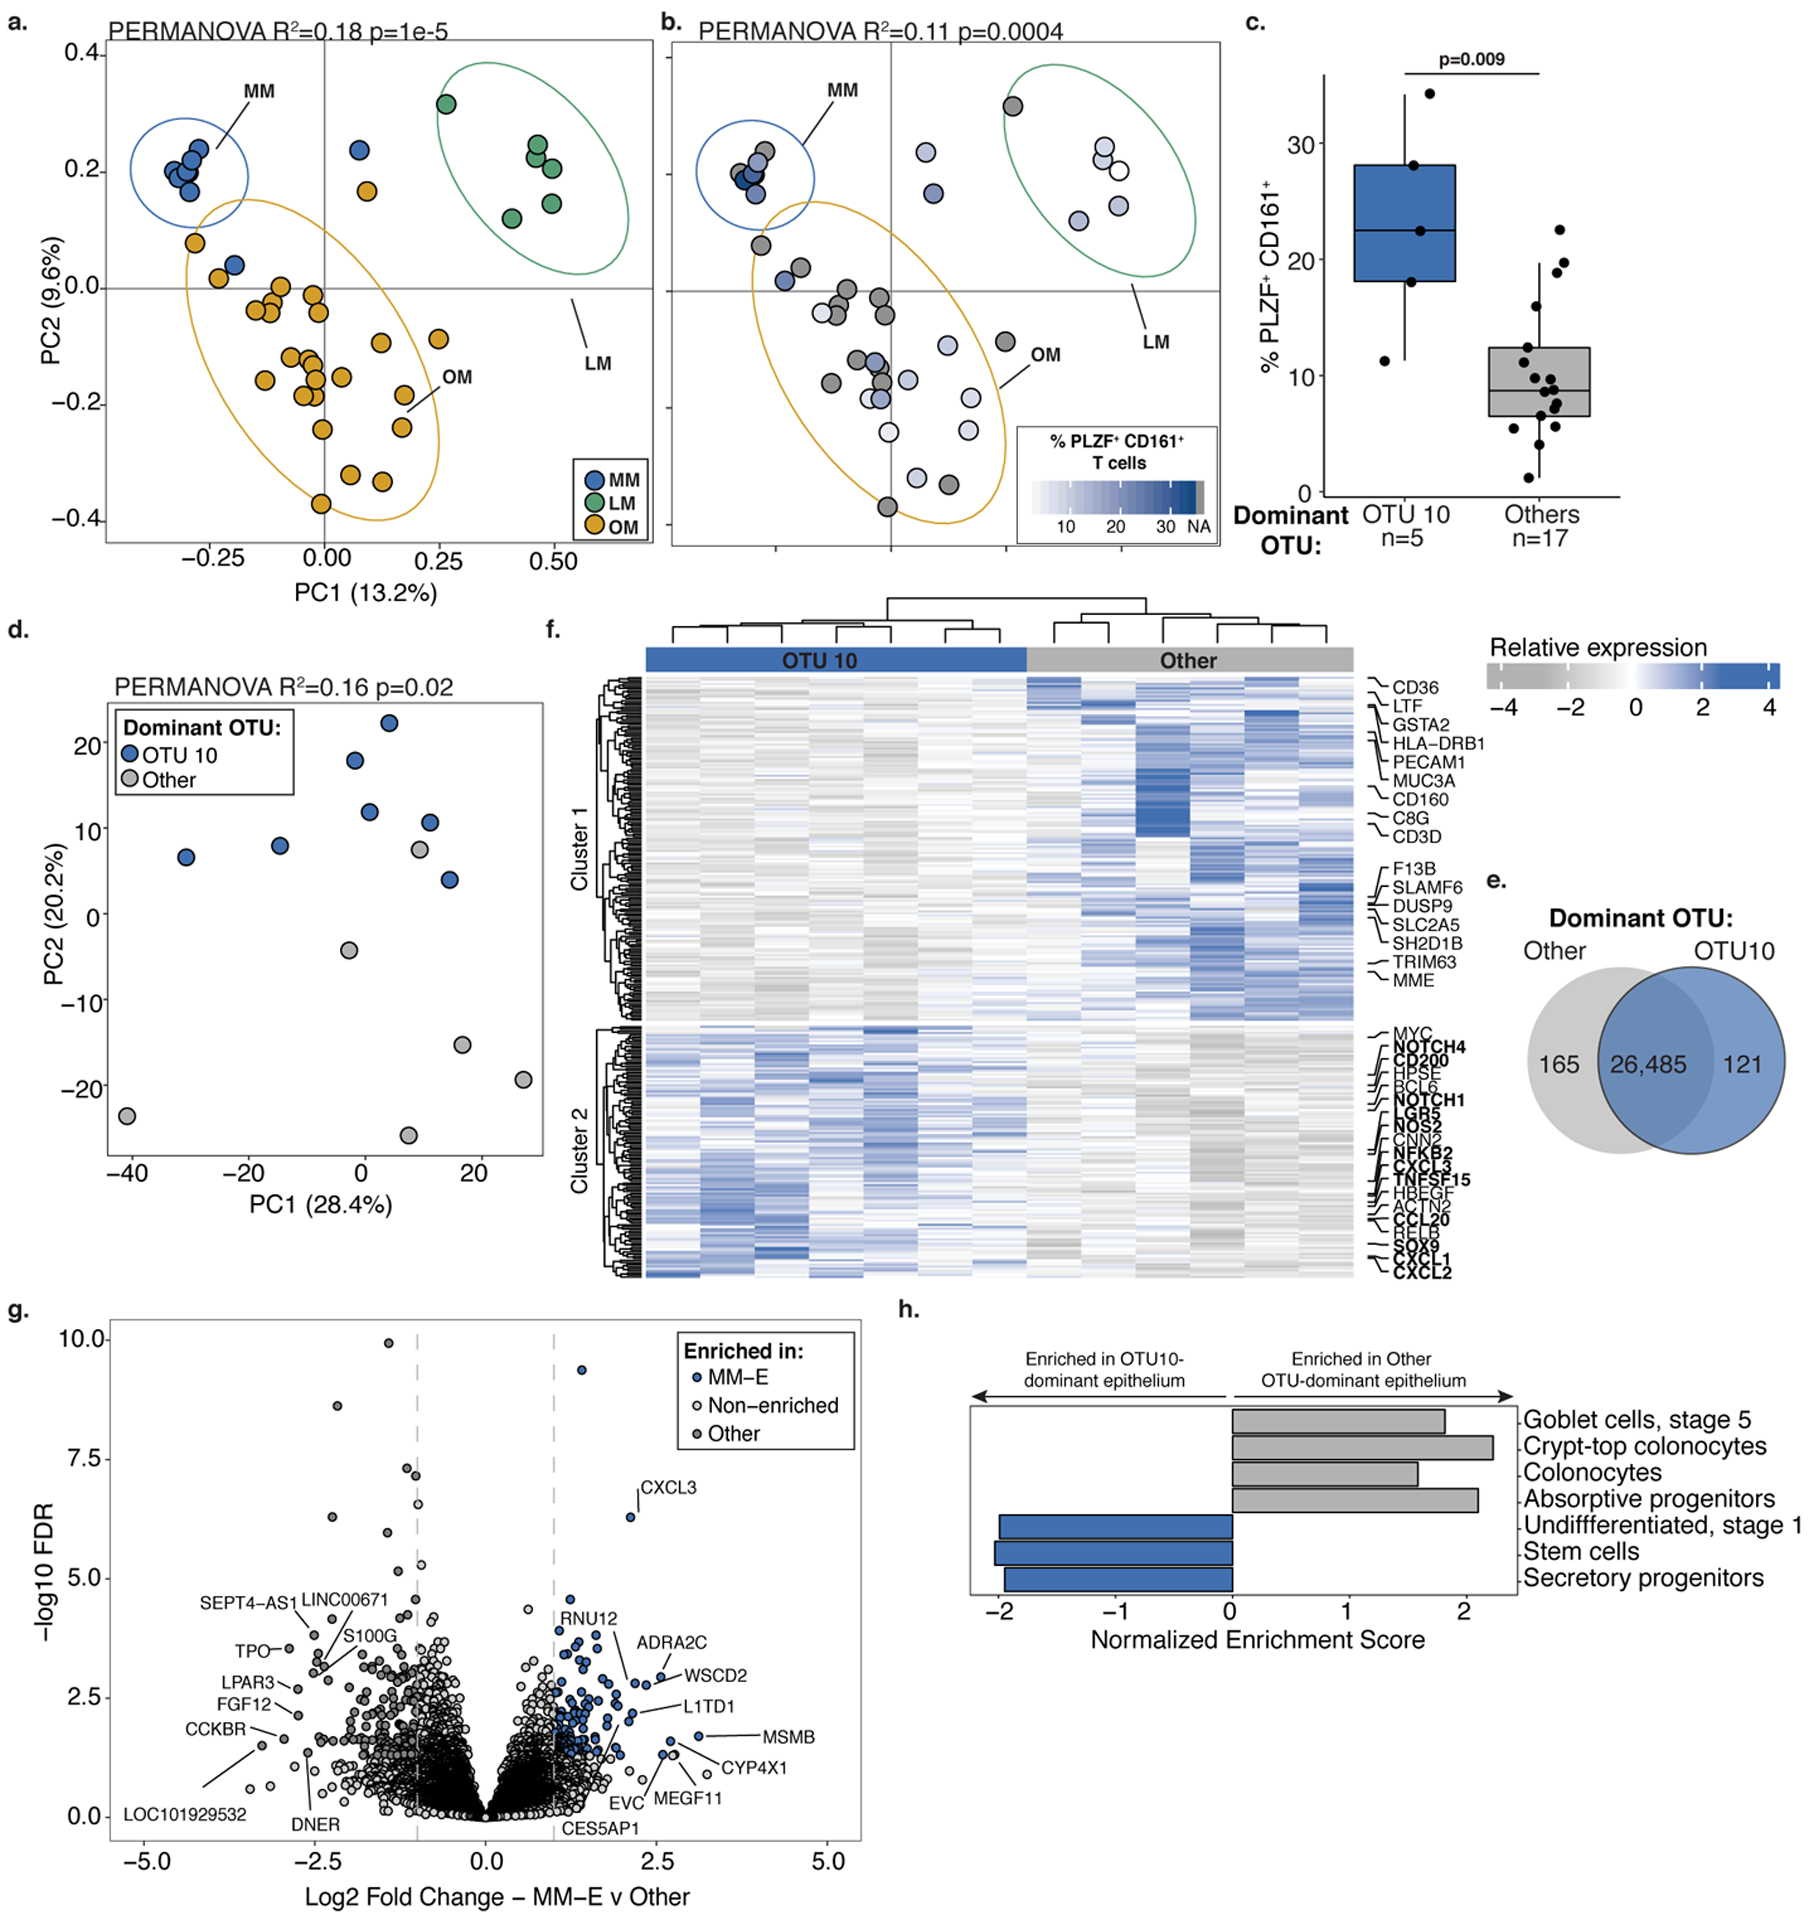
Figure 2. Divergent immune cell phenotypes are associated with Micrococcaceae relative enrichment in fetal meconium.

PCoA of Bray Curtis distances of 16S rRNA profiles colored by a. meconium dominated by Lactobacillus OTU12 (LM, n=6), Micrococcaceae OTU10 (MM, n=9), or other taxa (OM, n=25) or b. the proportion of PLZF+ CD161+ T cells among live, TCRβ+, Vα7.2−, CD4+ cells in intestinal lamina propria (LP) paired with LM (n=5), MM (n=5) or OM (n=12) samples indicated by ellipses at 95% confidence. c. Proportion of PLZF+ CD161+ T cells of live, CD4+ TCRβ+ Vα7.2− cells in LP among samples associated with meconium dominated by OTU10 (MM, n=5) or other OTUs (n=17). d. Principal components (PC) analysis of Euclidean distances of top 10000 variable genes (by coefficient of variation) in OTU10-dominated meconium associated epithelium (OTU10, MM-E, n=7) or other OTU-dominated meconium associated epithelium (Other, n=6) as determined by RNA sequencing. e. Venn diagram, f. heatmap with labeled immune pathway transcripts, and g. volcano plot of top differentially expressed genes between MM-E (n=7, log2 fold change >1, FDR < 0.05) and other OTU-dominated meconium associated epithelium (n=6, log2 fold change<1, FDR < 0.05). h. Normalized enrichment scores of gene set enrichment analysis of transcripts associated with epithelial cell states. For a-g, n indicates biologically independent fetal samples. PERMANOVA test for significance for a-b, d. Two-sided Wilcoxon rank sum test was used for c. DESEQ2 was used to calculate significant genes using a two-sided false discovery rate and log2 fold change. Each dot represents one independent biological replicate in a-d and one transcript in g. Boxplot indicates the median (center), the 25th and 75th percentiles, and the smallest and largest values within 1.5× the interquartile range (whiskers).
