
Extended Data 3. Sparse bacterial signal distinct from background detected in fetal meconium.
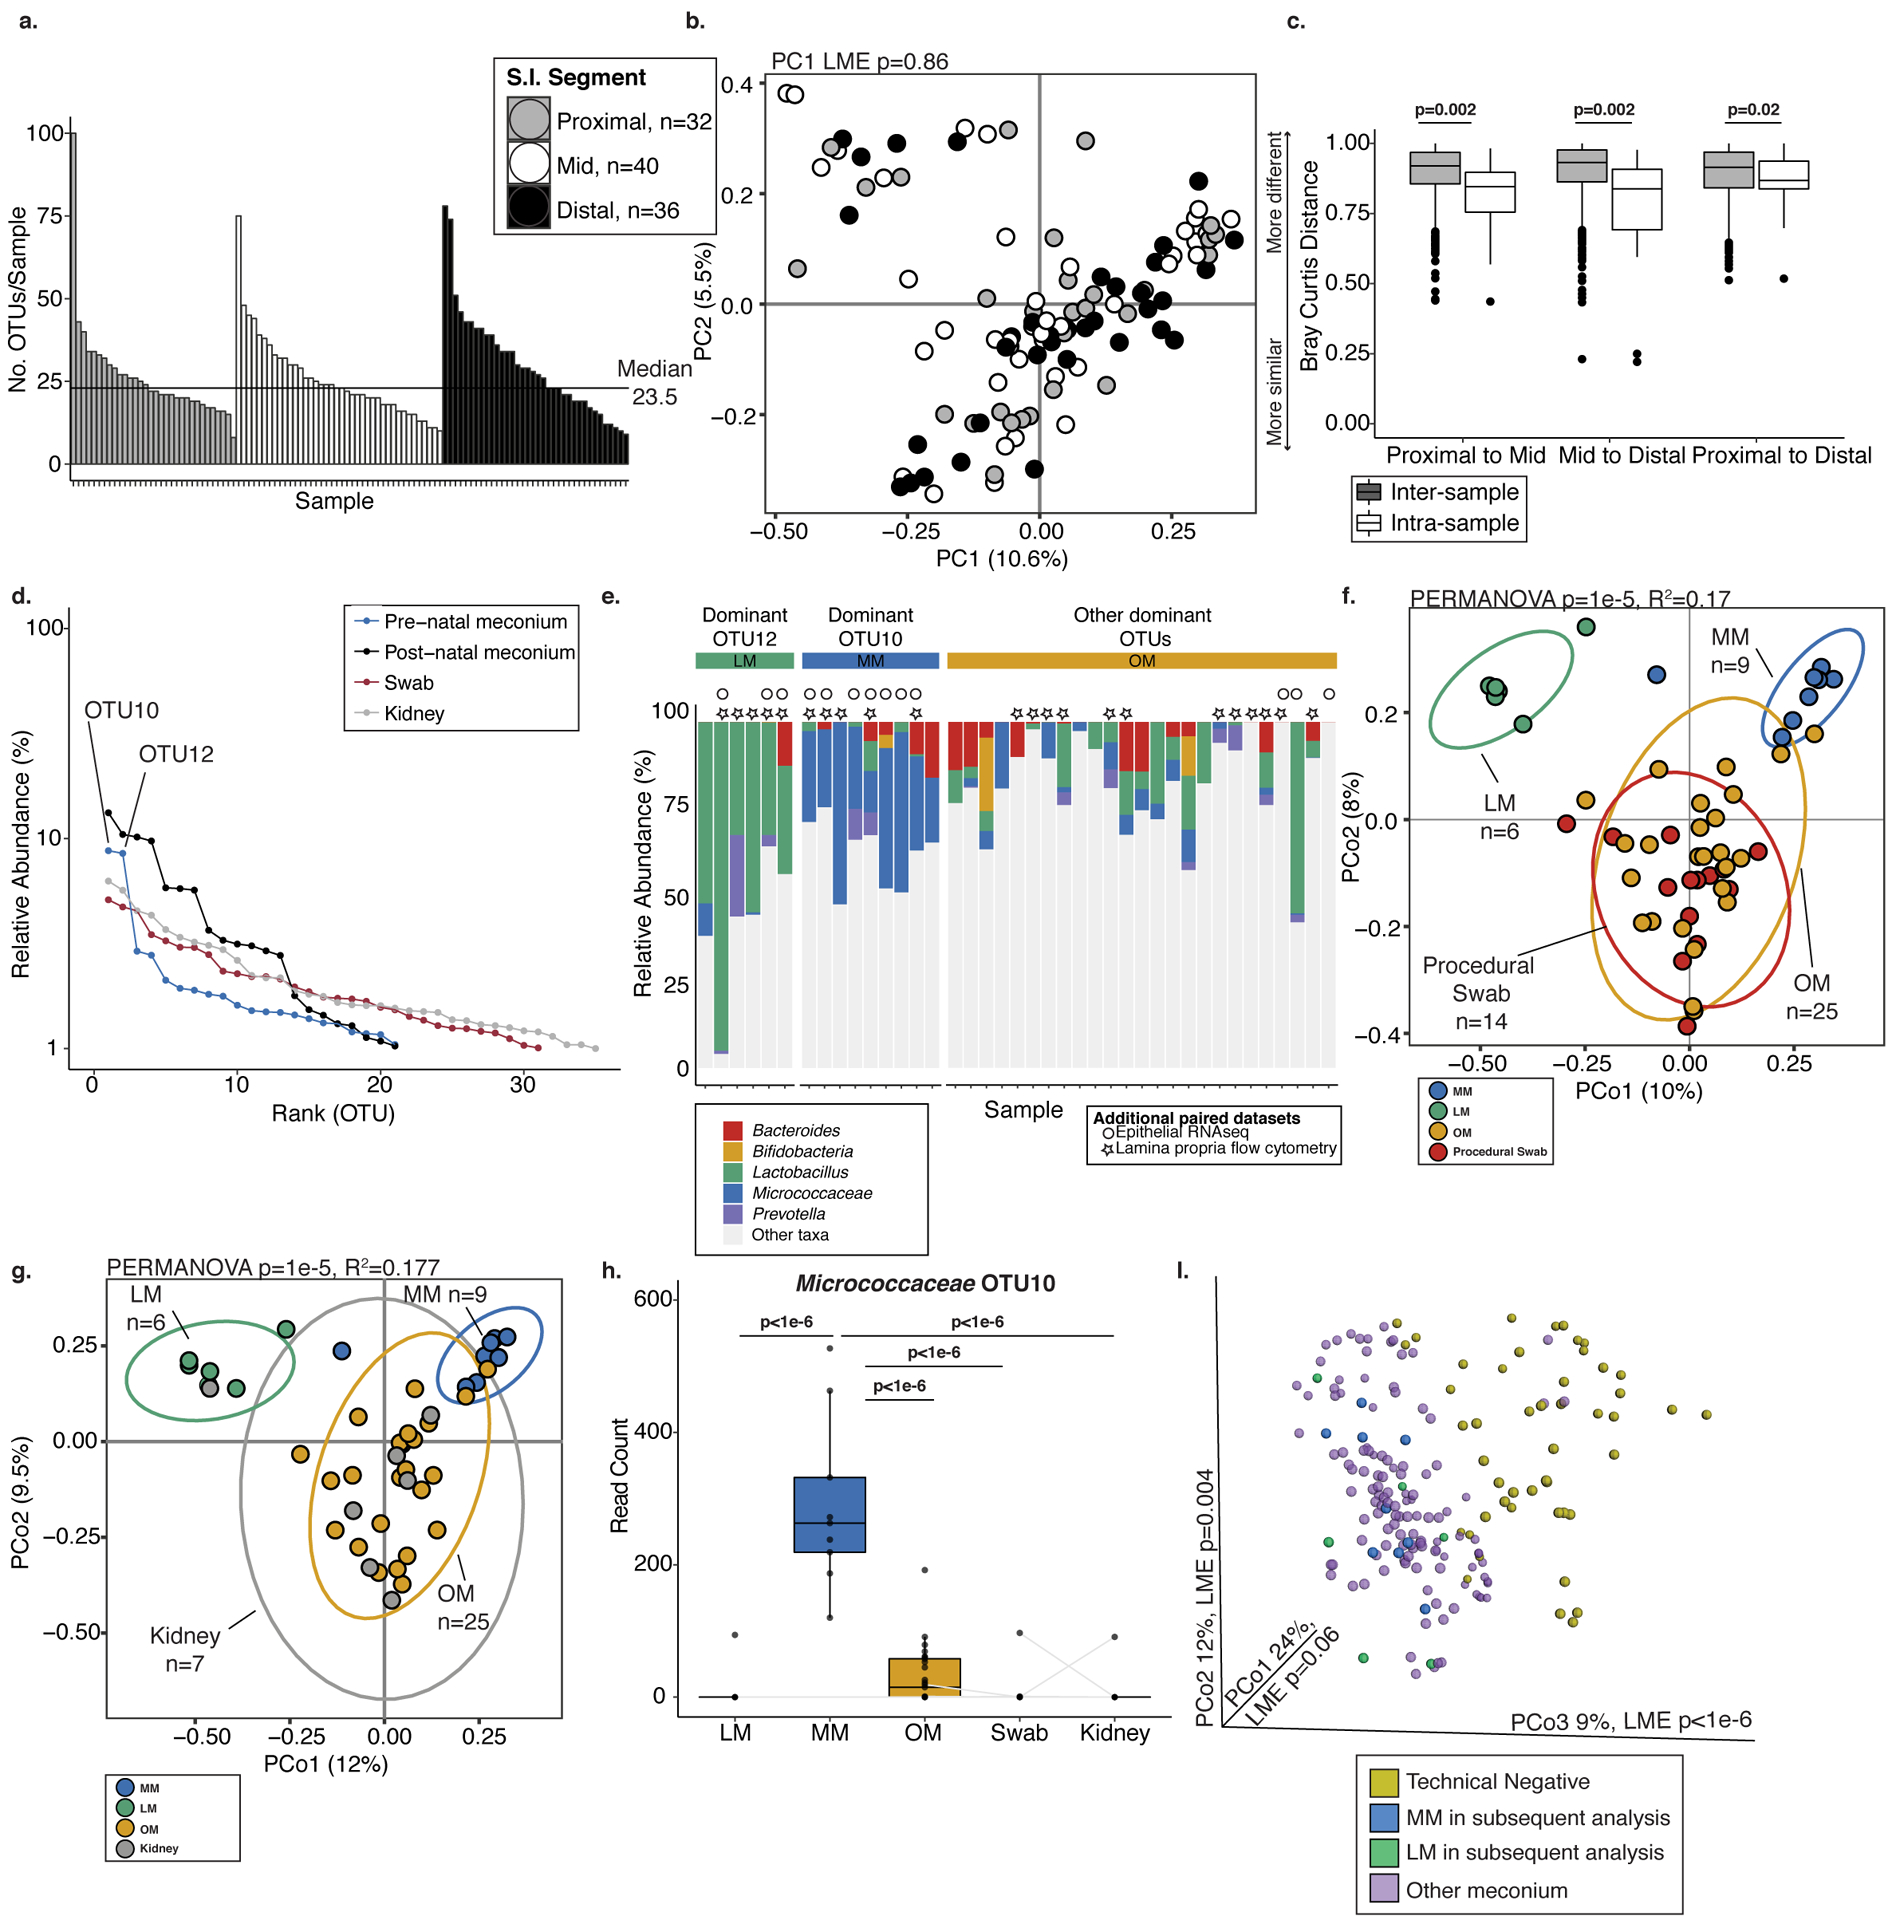
a. Histogram of number of operational taxonomic units (OTUs) per sample detected in fetal meconium from proximal-, mid-, or distal-segments of the small intestine after technical control filtering. b. Principal coordinates analysis (PCoA) of Bray Curtis distances of rareified bacterial profiles of proximal- (n=32), mid- (n=40), and distal- (n=36) sections of the intestine. c. Inter- and intra-sample Bray Curtis distances between indicated comparisons of proximal- (n=32), mid- (n=40), and distal- (n=36) intestinal sections. For a-b, n represents biologically independent fetal samples across the length of the intestine. d. Bacterial abundance ranks in fetal meconium, post-natal meconium, procedural swab, and kidney control. e. Relative abundance of select genera among samples dominated by OTU12, OTU10, or other OTUs. Symbols indicate samples with paired immunological datasets. PCoA of Bray Curtis distances of Lactobacillus-meconium (LM, n=6), Micrococcaceae-meconium (MM, n=9), or Other-meconium (OM, n=25) compared to f. procedural swab (n=14) or g. fetal kidney (n=7) control, where n represents biologically independent fetal samples. h. Normalized read counts for Micrococcocaceae OTU10 in LM (n=6), MM (n=9), OM (n=25), swab (n=14), and fetal kidney (n=7) control samples, where n represents biologically independent fetal samples; samples collected from the same fetus indicated by grey line, when possible. i. PCoA of Bray Curtis distances of unrareified and unfiltered bacterial profiles of meconium (n=138 biologically independent fetal samples across three segments of the intestine) with technical negative controls (n=48 biologically independent samples including extraction buffer, room air swab, pre-moistened swabs). LM (n=6) and MM (n=9) samples identified in later analyses are highlighted; significance was measured using two-sided Satterthwaite’s method on linear mixed effects model to test for significance and correct for repeated measures in b,h; ANOVA of linear mixed effects model was used to test for significance and correct for repeated measures in i, two-sided t-test was used for c, PERMANOVA was used in f-g. Boxplots indicate the median (center), the 25th and 75th percentiles, and the smallest and largest values within 1.5× the interquartile range (whiskers).