
Extended Data 4. Divergent epithelial transcriptome and lamina propria T cells in samples associated with LM, MM, or OM.
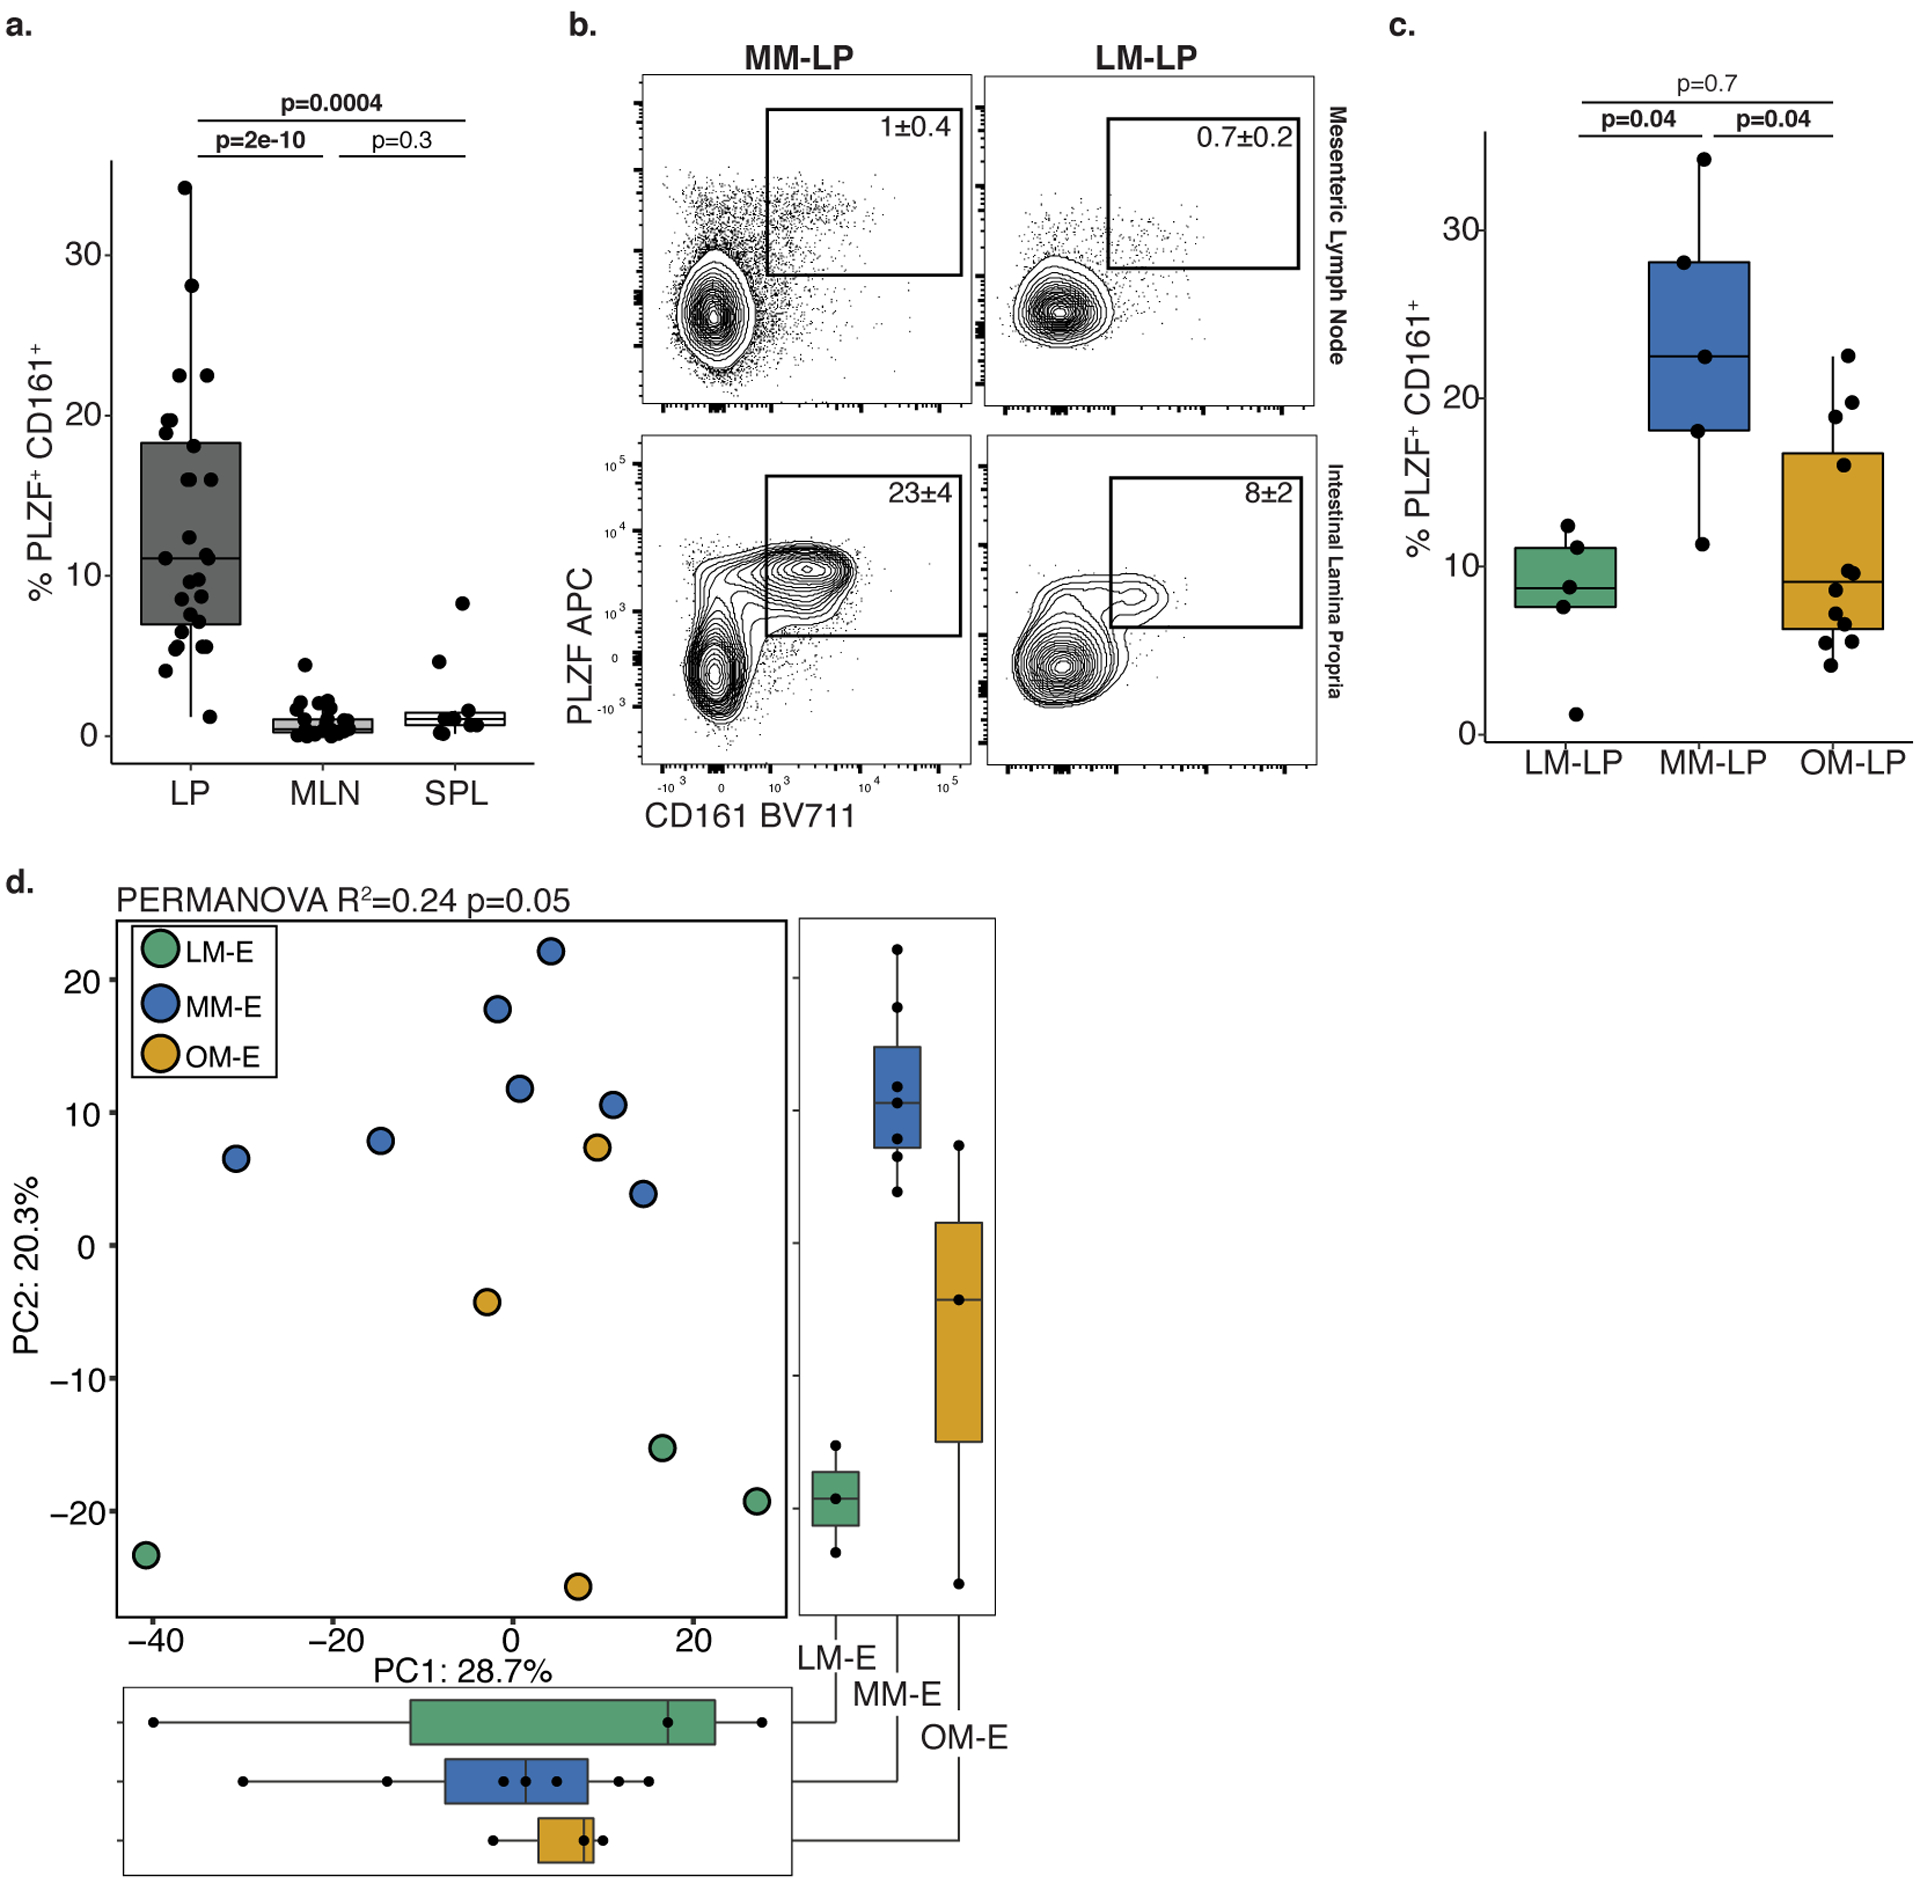
a. Proportion of PLZF+ CD161+ T cells among live, TCRβ+, Vα7.2−, CD4+ cells in intestinal lamina propria (LP, n=28), mesenteric lymph node (MLN, n=27), and spleen (SPL, n=10) where n is a biologically independent fetal sample. b. Representative flow plots of mesenteric lymph node (top panel, gating control) or intestinal lamina propria (bottom panel) associated with MM and LM. Experiments were repeated 5 independent times for each LM and MM associated samples with similar results. c. Proportion of PLZF+ CD161+ T cells in intestinal lamina propria paired with LM, MM, or OM (LM-LP, n=5; MM-LP, n=5; OM-LP, n=12) among live, TCRβ+, Vα7.2−, CD4+ cells. d. Principal components (PC) analysis of Euclidean distances of top 10000 variable genes (by coefficient of variation) in LM associated epithelium (LM-E, n=3), MM associated epithelium (MM-E, n=7), or OM associated epithelium (OM-E, n=3) as determined by RNA sequencing where n represents a biologically independent fetal sample. Kruskal-Wallis ANOVA, with Dunnet’s correction for multiple comparisons was used for a, c. PERMANOVA test for significance in d. Each dot represents a biological replicate. Boxplots indicate the median (center), the 25th and 75th percentiles, and the smallest and largest values within 1.5× the interquartile range (whiskers).